hp2pretty-0.5 released
↑ hp2pretty-0.4 was slow | hp2pretty-0.5 is fast ↓
While trying to figure out what the correct way to handle character codings in GHC heap profile output is to fix hp2pretty so it doesn't output invalidly encoded UTF-8 XML SVG (which breaks rsvg rendering), I stumbled upon hp2any which has somewhat related aims.
So to avoid duplication of effort, I hacked on hp2pretty to make it use hp2any-core for as much as possible. Unfortunately, while initial benchmarks seemed promising (if anything my original code was slightly slower), when I tried it on a huge test input file it didn't fare so well:
$ ls -1sh huge.hp
36M huge.hp
$ time hp2pretty-0.4 huge.hp
real  1m49.979s
user  1m49.440s
sys   0m0.500s
-- observed memory usage in top: 100M
$ time hp2pretty-0.4-with-hp2any-core huge.hp
real  2m52.501s
user  2m51.470s
sys   0m0.930s
-- observed memory usage in top: 800M
Even though it took 50% longer and used 8x as much memory, it didn't magically fix my character encoding issues. But I thought it was on the right track to avoid duplication of effort, as hp2any has a nice API.
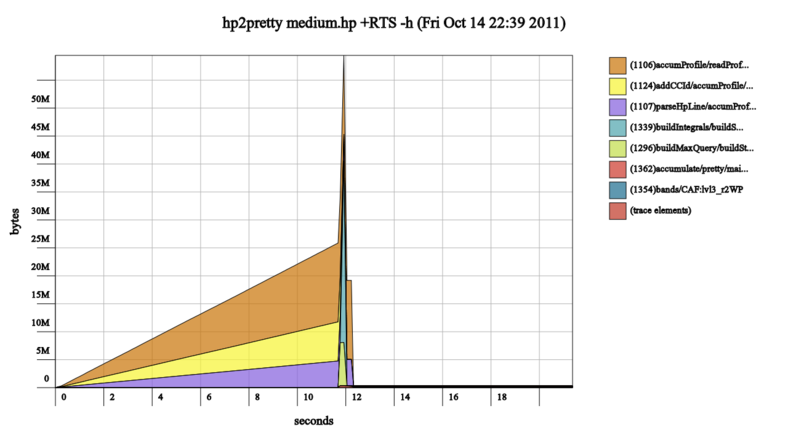
So I profiled heap usage, and got a huge spike with uninformative labels:
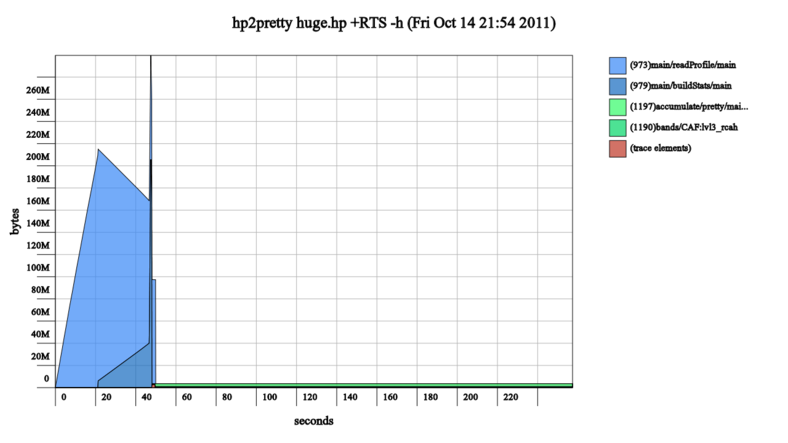
Adding cost centers helped to see where the problem might be:
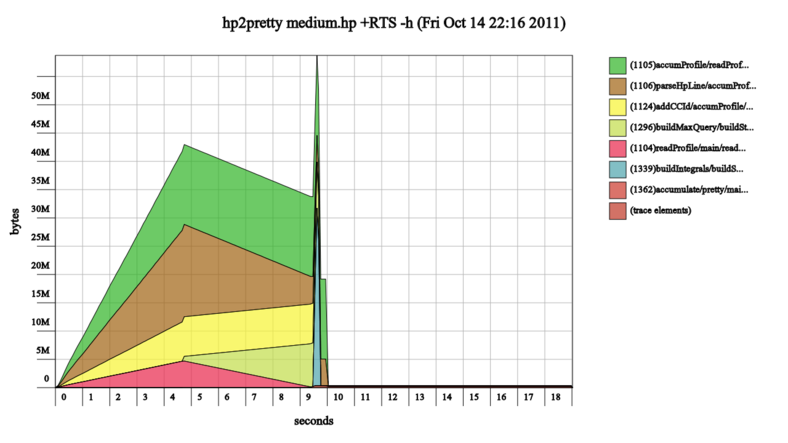
Using pattern matching to deconstruct lists once to reuse the pieces fared better than multiple uses of head and tail, but adding strictness to the intermediate token data type in the parser was the biggest win:
When tested on the huge.hp file, it fared better than my original code:
$ time hp2pretty-using-patched-hp2any-core huge.hp
real  1m36.002s
user  1m35.290s
sys   0m0.680s
-- observed memory usage in top: 500M
But once you get a taste for acceleration, it's hard to stop... further slownesses were targeted and squashed using time/allocation profiling:
- Faster printing!
using fshow from the floatshow package with Double7 newtype wrapper reduced runtime from 240 seconds to 43 seconds. This made the next big target more visible...COST CENTRE MODULE %time %alloc showF SVG 83.7 88.3
- Streamlined logic!
Inlining some association list creation and key lookup reduced runtime from 43 seconds to 36 seconds. Not much of an improvement, so I added some cost centre annotation pragmas...COST CENTRE MODULE %time %alloc parseHpLine Profiling.Heap.Read 54.2 63.0
- Faster parsing!
Using double from the attoparsec package with parseOnly driver reduced runtime from 36 seconds to 18 seconds (with profiling enabled).COST CENTRE MODULE %time %alloc pEndSample Profiling.Heap.Read 26.4 30.8 pBeginSample Profiling.Heap.Read 24.5 30.8
- What's left?
With showF as optimized as it can seemingly be, there's no standout target as a low-hanging fruit to be picked for big speed gainsCOST CENTRE MODULE %time %alloc showF SVG 39.1 38.9 main Main 9.7 11.5 bands Bands 8.6 4.3 readProfile Profiling.Heap.Read 7.4 8.6 buildIntegrals Profiling.Heap.Stats 7.0 6.3
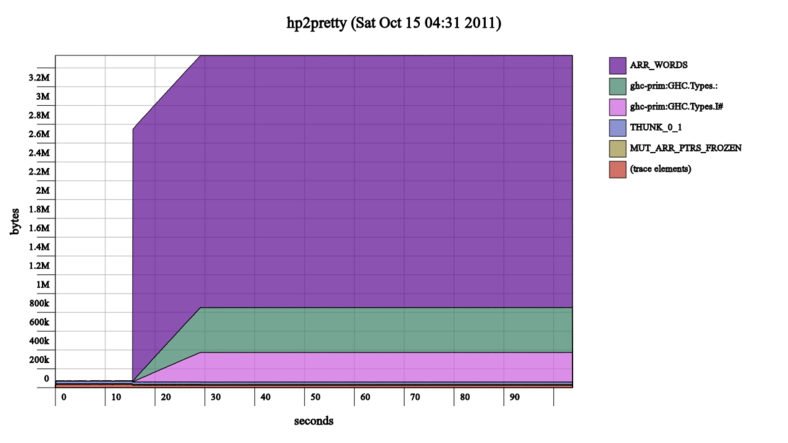
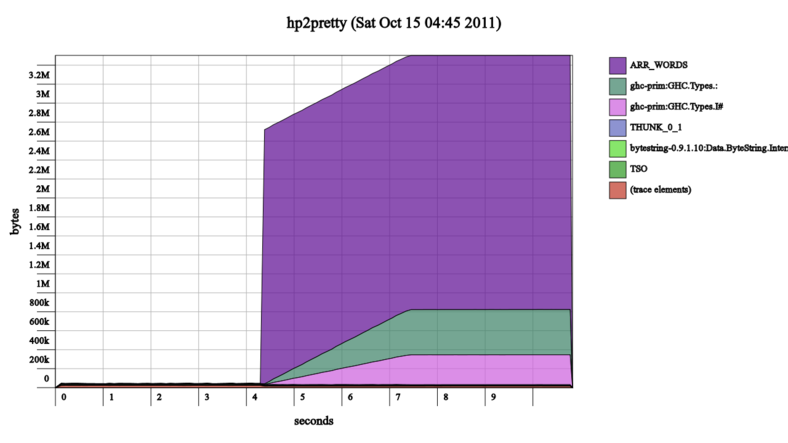
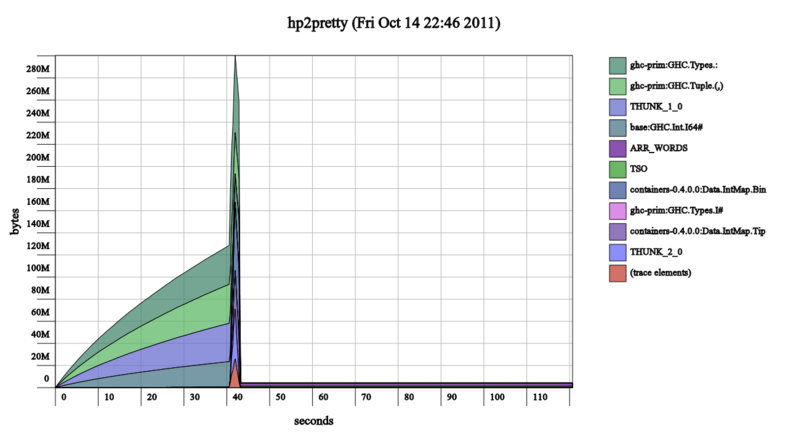
So this round of painting on go faster stripes is done, and made the heap profile graphs go from looking somewhat like this:
to looking more like this:
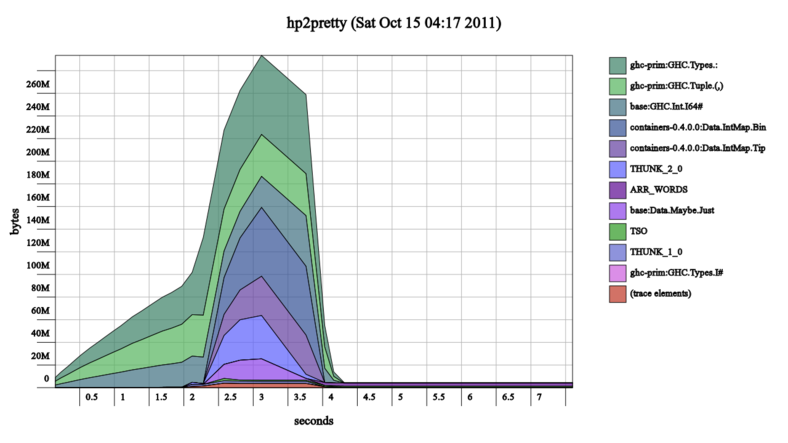
Note the timescale at the bottom of the graphs, I neglected to keep the heap profile output files as well as the output images so I couldn't use hp2pretty's uniform scale options.
With profiling disabled, hp2pretty using the repatched hp2any-core is really quite a lot faster than the original hp2pretty-0.4:
$ time hp2pretty-using-repatched-hp2any-core huge.hp
real  0m9.919s
user  0m9.520s
sys   0m0.400s
Comparing very favourably to:
$ time hp2ps huge.hp
real  0m32.869s
user  0m32.760s
sys   0m0.090s
I've sent the relevant patches to hp2any-core to its upstream maintainer, but in the meantime I backported the floatshow and attoparsec usage to the master branch of hp2pretty, and released v0.5:
hp2pretty v0.5 2011-10-15 acceleration
Vastly improved runtime performance thanks to 'floatshow' and 'attoparsec' for (respectively) printing and parsing floating point numbers.
Source code statistics: 544 lines, 3275 words, 20061 chars.
Download hp2pretty-0.5.tar.gz, or install from Hackage:
cabal install hp2pretty
or you can get the latest development source from hp2pretty/hp2pretty on Gitorious hp2pretty on code.mathr.co.uk.
For more info on actually generating heap profiles, check out the GHC heap profiling manual.