Calendar 2015 - Gradient

I've already blogged a bit about this calendar image for April (yep, late again...). I made a diagram using Fragmentarium to show the principle behind it:
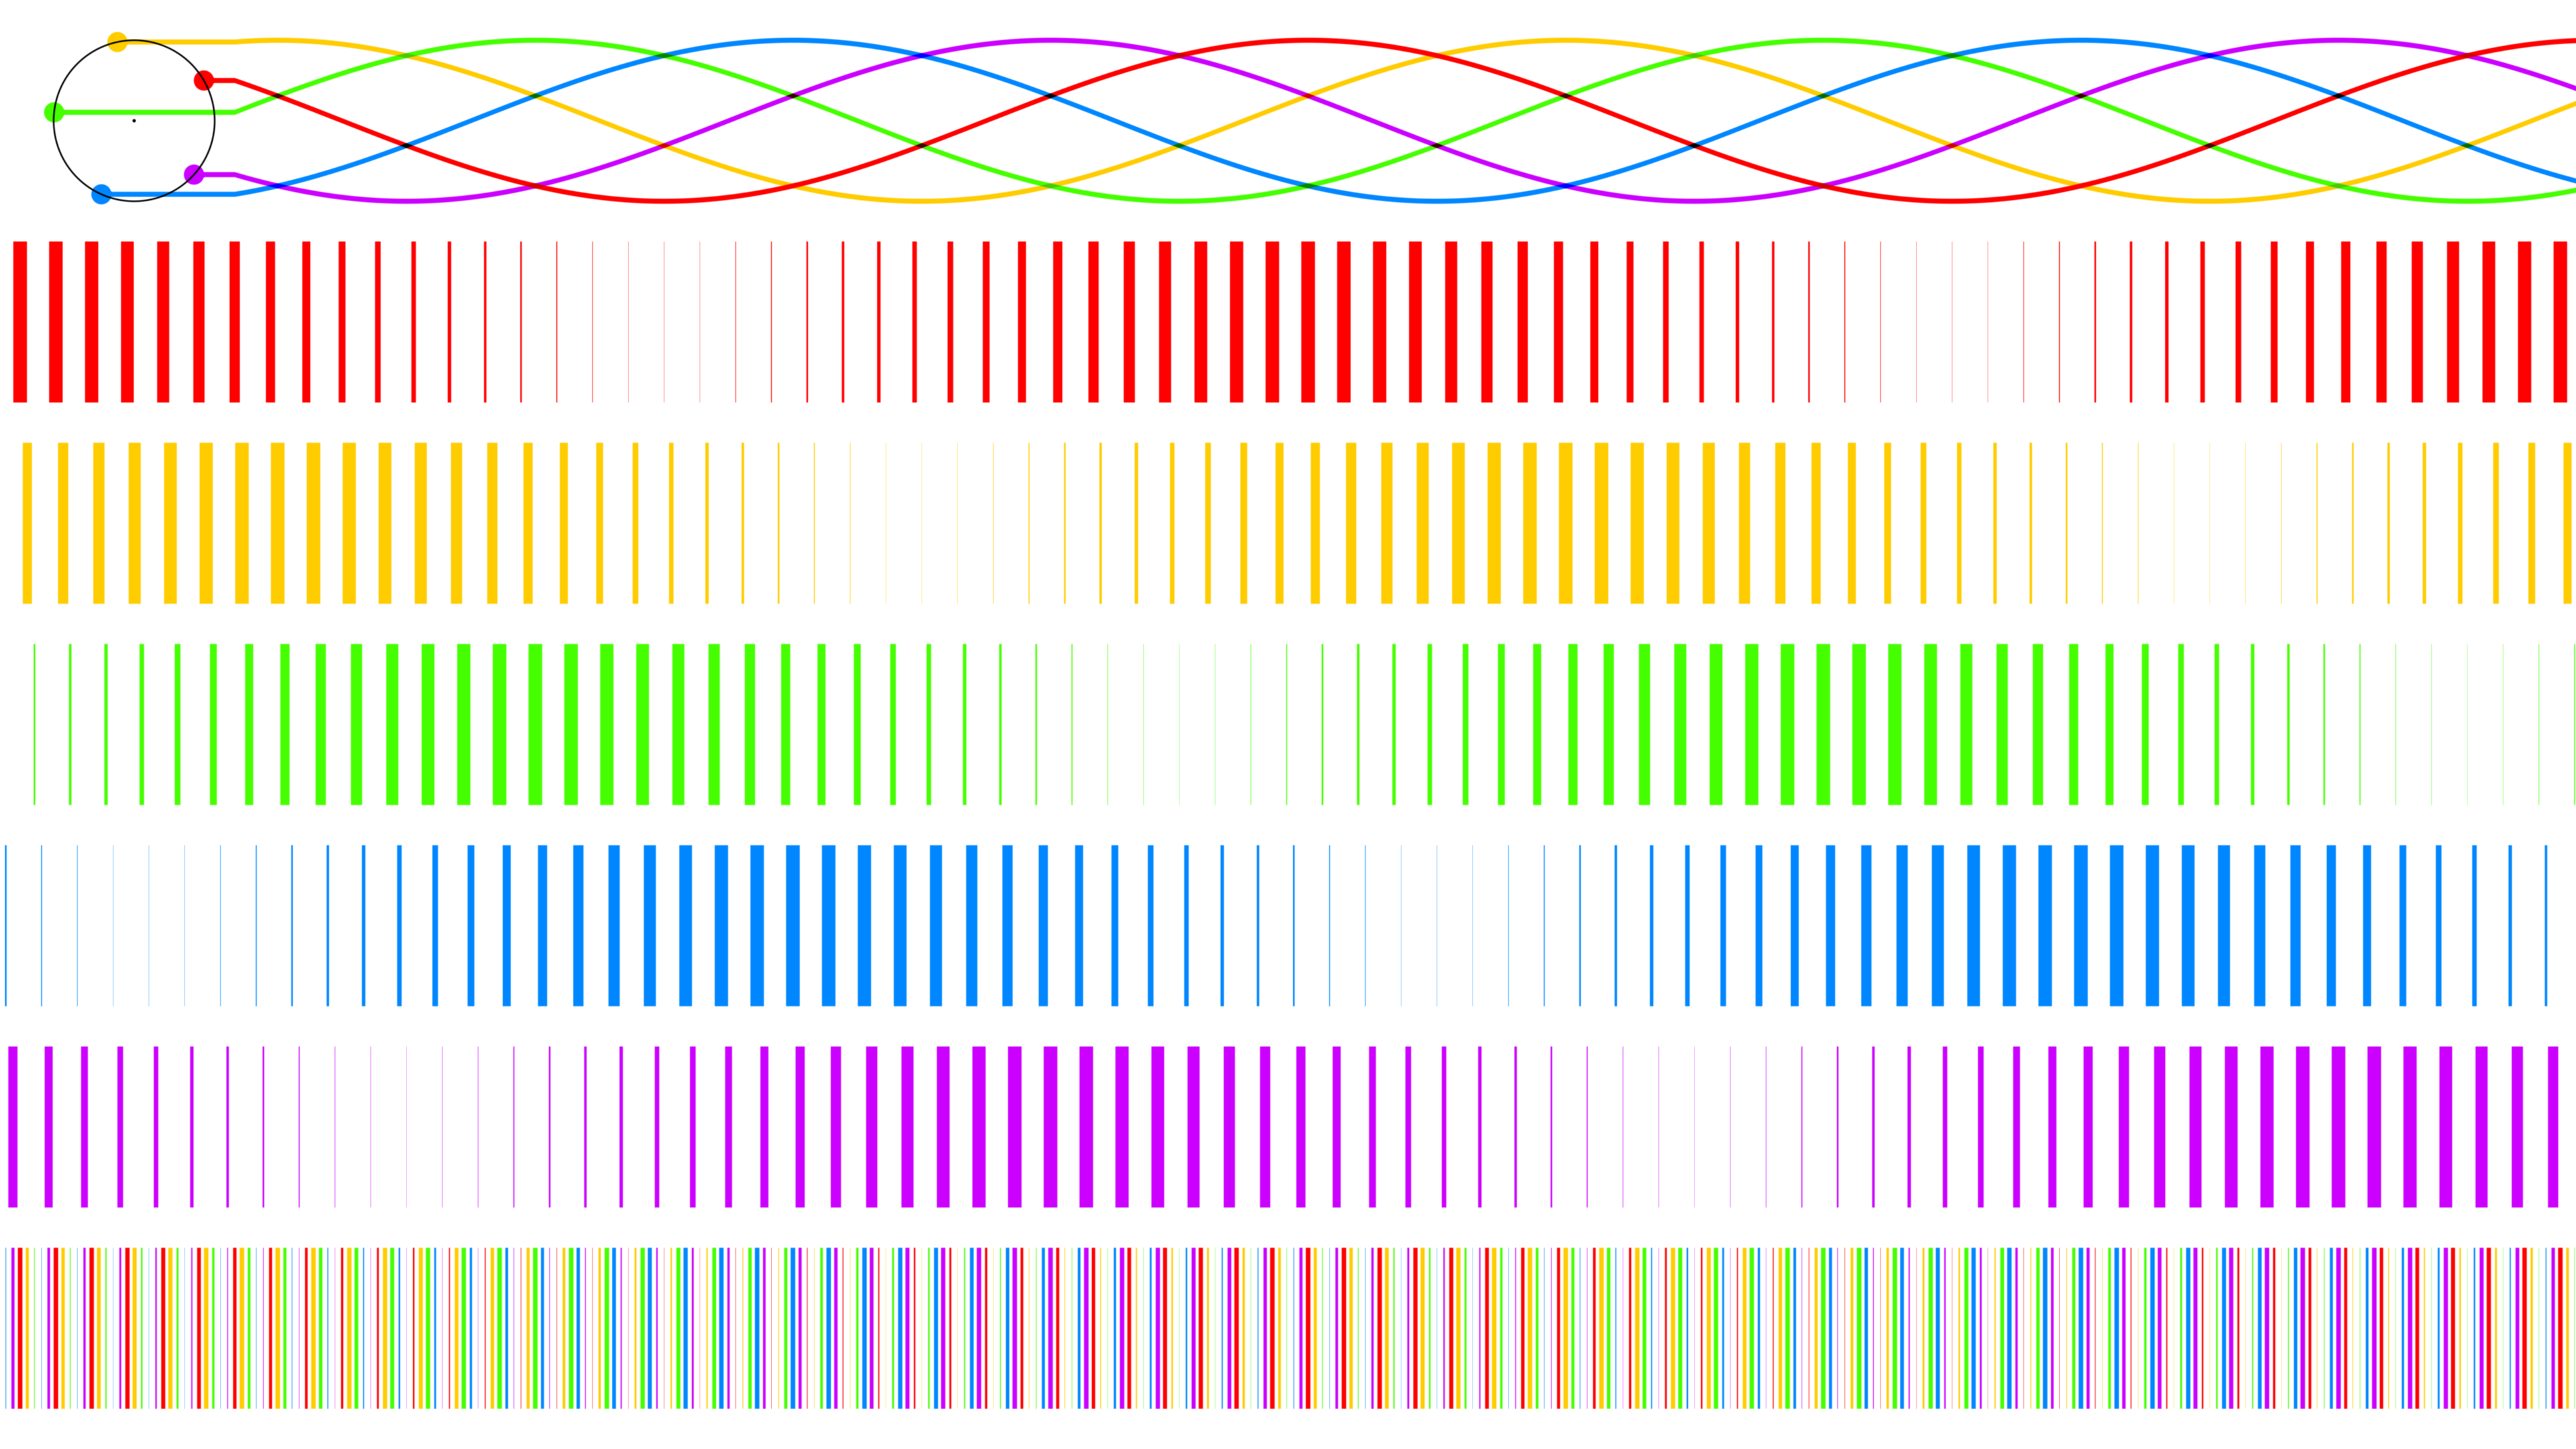
Five points forming a regular pentagon rotate, their vertical coordinates make five sine waves. Each wave is split into a number of rectangles, whose width depends on the height of the wave. Then all five sets of rectangles are overlayed. Because the centroid of the pentagon is fixed no matter the rotation angle, the sum of the waves remains constant - this property is used in windowed overlap add resynthesis of FFT for frequency-domain processing in audio.
But it's not the same as the original, which you can tell by zooming in:

The original (above) has an equal amount of white space between each coloured strip, while in the recreation (below) the amount of white space changes. And the order of the colours in the recreation is flipped from the original, and the coloured strips in the recreation are a bit narrower than the original too.

You can download the source code for the recreation: gradient.frag. For extra fun switch to animation mode in Fragmentarium to see the pentagon rotate with the waves streaming out from it. I did render a video but it looks really horrible compressed, so unless you have Fragmentarium or you wait until I get around to porting this code to WebGL (not very likely..) you'll just have to imagine it.