Modes in a box
This week I discovered just how bad the acoustics in my front room are. At my typical listening position (sat in front of the computer) there are two huge spikes in the frequency response at around 45Hz and 140Hz (measured with JAAA, an audio analyzer). Unsurprisingly this has a big effect on the music I make, to the extent that some of it sounds wrong to my ears when I listen in other environments (even including other spots in the same room):
- source audio composed and recorded digitally
- recorded with mics at four different listening positions
So I was looking around for ways to mitigate the problem, starting with simple things like moving the desk and speakers to a different position in the room. But my desk is heavy and bulky and has a zillion cables dangling all over it, so moving it around is awkward. Referring back to my blog post about modes on a plate I thought computer simulation could be part of the answer.
Happily I found a really nice paper full of equations (even two different room response modelling algorithms) and a section on just the problem I'm facing (namely optimising speaker and listener positions to get the frequency response as flat as possible):
Room Sizing and Optimization at Low Frequencies
Trevor J. Cox, Peter D'Antonio, and Mark R. Avis
J. Audio Eng. Soc., Vol. 52, No. 6, 2004 June
I implemented in Haskell (source code links at the end of this post) the first prediction model in the paper, the modal decomposition model. I made a couple of slight changes to the equations in the paper: the term \(w_n \delta_n\) is a bit redundant, because \(\delta_n\) has a division by \(w_n\), so I avoid dividing and multiplying again (which avoids NaN dread when \(w_n\) is \(0\)). Here are some of its predictions (click for larger):
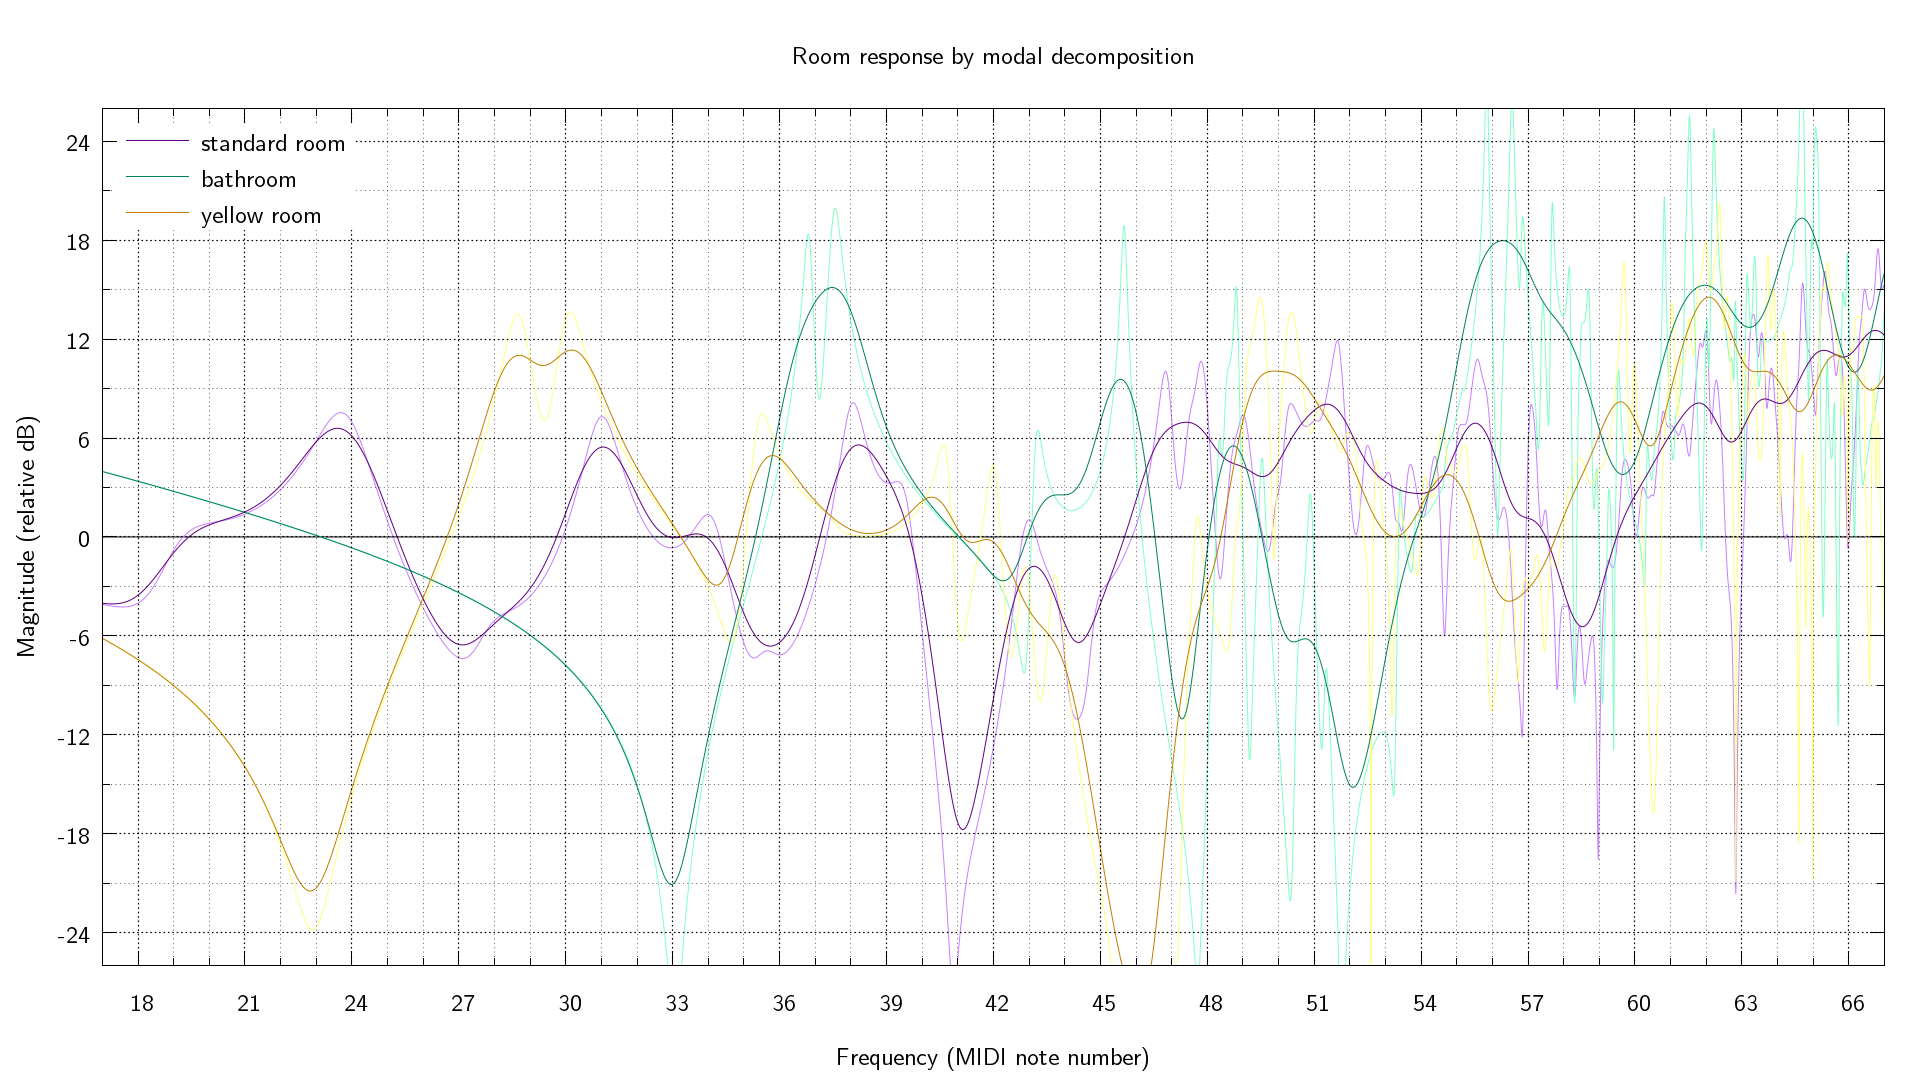
The yellow room is where my computer is, and has roughly accurate room size and speaker and listener positions, but I guessed the wall absorption coefficients (and the algorithm to convert absorption coefficients to admittances, I used Daniel A. Russell's Absorption Coefficients and Impedance). The bathroom likewise (though I have no speakers in the bathroom and I don't sing in the shower), and the standard room size and absorption is from the paper but I picked the positions myself. I used \(343 m s^{-1}\) as the speed of sound. I used gnuplot to smooth the computed data using its kernel density method, as the specific locations of the narrow peaks and troughs in the response are very sensitive to slight variations in the parameters.
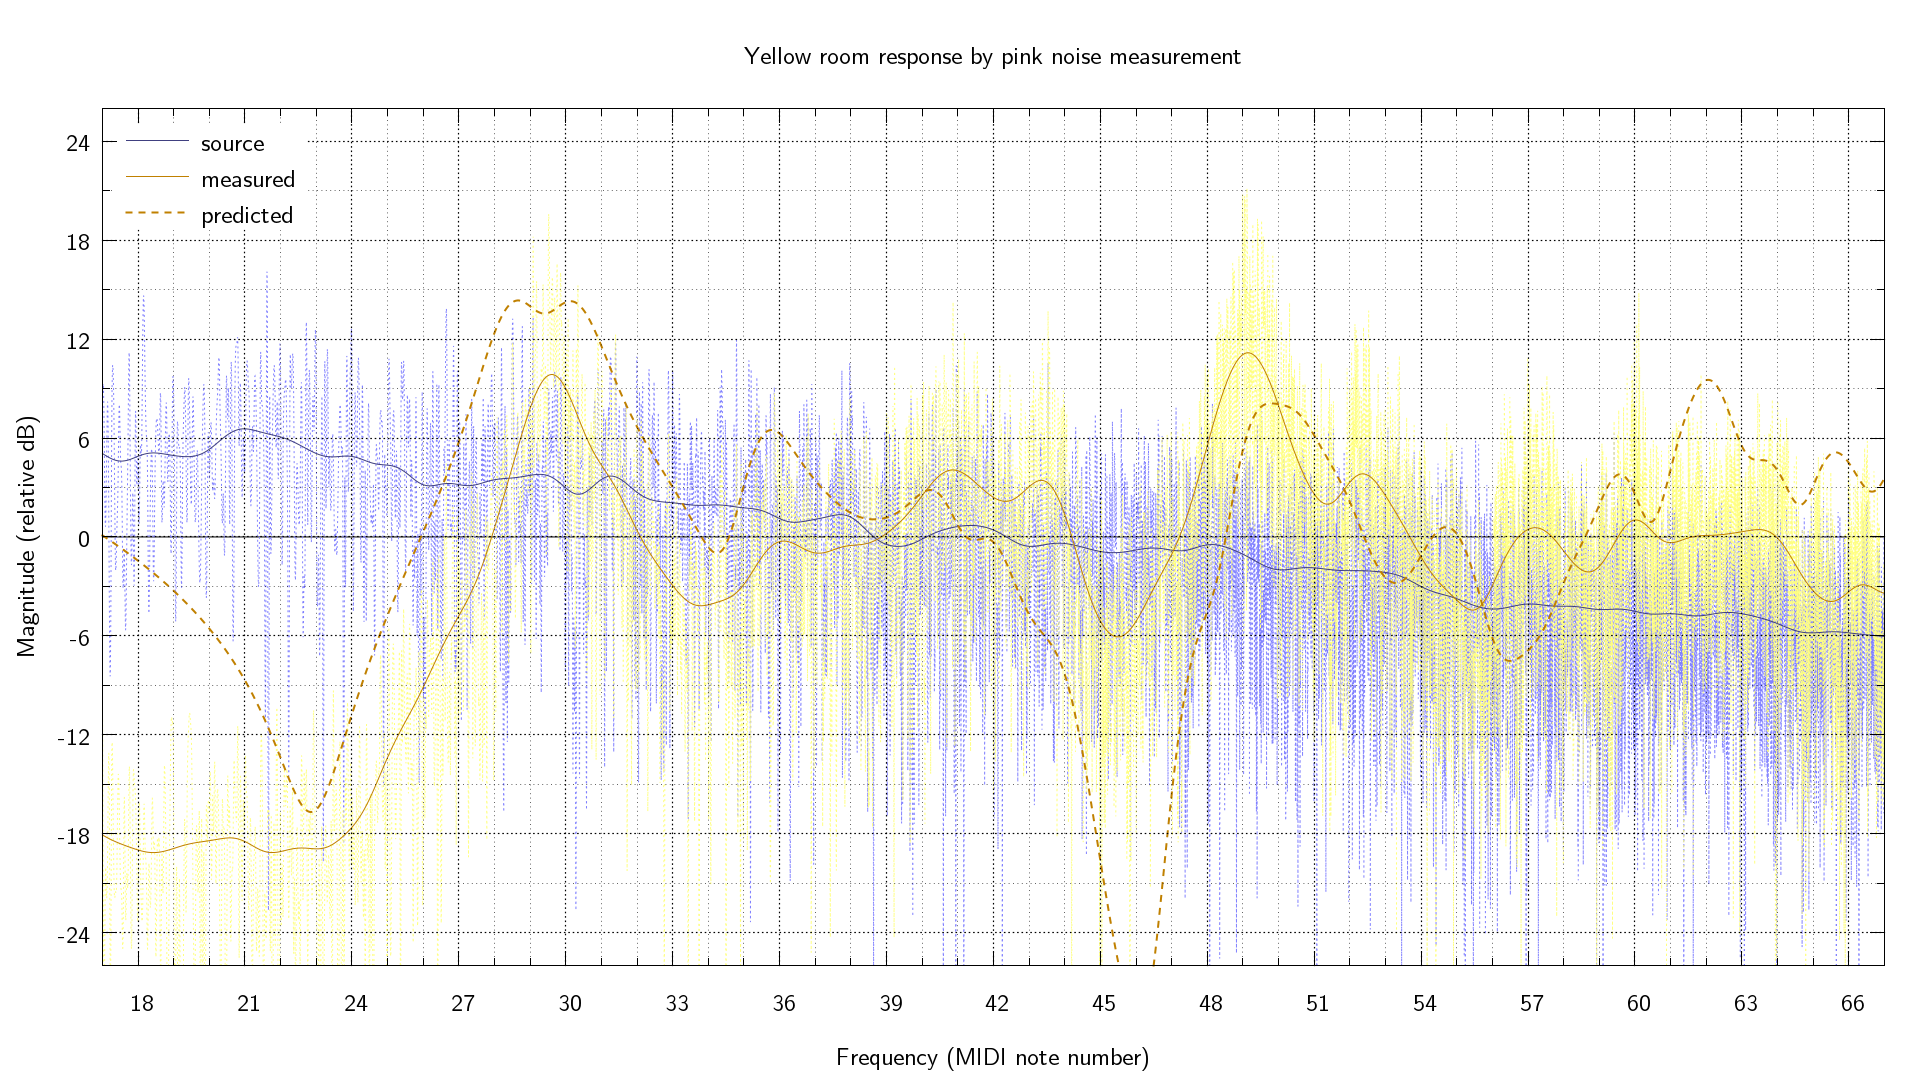
Then I generated some pink noise with audacity, and recorded it for analysis. Note that this measures the combined frequency response of the sound-card DAC, the speaker cones, the mics, and the recorder ADC; as well as the room response I'm interested in - so it's not really a proper test, just enough to get a rough idea. I also performed the test with stereo speakers, the modal model code can be extended for more speakers quite easily but I didn't use that for the graph above.
I wrote a small C program using fftw and sndfile to get the spectrum (I used ~21 seconds), and more gnuplot stuff to smooth it - the FFT has linear frequency but I wanted to convert it to logarithmic frequency, and gnuplot kernel density smoothing needs to know the resolution of the data, which increases with frequency when \(\log\)ing. I added the modal prediction to the graph, it's actually not too far out:
Source code download links: