Periodicity scan

The Mandelbrot set contains many hyperbolic components (cardioid-like and disc-like regions), with hairy filaments connecting them in a tree-like way. Each component has a nucleus at its center, which has a periodic orbit containing 0. Each component is surrounded by an atom domain, which for discs has about 4 times the radius (the relationship for cardioids is less regular, but often has about the square root of the size). Labelling a picture of the Mandelbrot set with the periods can provide insights into its deeper structure, and most of the time using the atom domain size as the label size works pretty well.
Inspired by a feature of Power MANDELZOOM (scroll down to the 3rd image titled "Embedded Julia set") that locates periodic points that are too deep to see, I implemented a grid scan algorithm to find periodic points. I vaguelly recall Robert P. Munafo explaining this algorithm to me in private email, so most of the credit belongs with him. The font size variation is all mine though.
Using my mandelbrot-numerics and mandelbrot-graphics libraries, the period scan works like this:
// scan successively finer grids for periods
for (int grid = mingridsize << 8; grid >= mingridsize; grid >>= 1)
  for (int y = grid/2; y < h; y += grid)
    for (int x = grid/2; x < w; x += grid)
    {
      double _Complex c0 = x + I * y;
      double _Complex dc0 = grid;
      // transform pixel coodinates to the 'c' plane
      m_d_transform_forward(transform, &c0, &dc0);
      // find the period of a nucleus within a large box
      // uses Robert P. Munafo's Jordan curve method
      int p = m_d_box_period_do(c0, 4.0 * cabs(dc0), maxiters);
      if (p > 0)
        // refine the nucleus location (uses Newton's method)
        if (m_converged == m_d_nucleus(&c0, c0, p, 16))
        {
          // verify the period with a small box
          // if the period is wrong, the size estimates will be way off
          as[atoms].period = m_d_box_period_do(c0, 0.001 * cabs(dc0), 2 * p);
          if (as[atoms].period > 0)
          {
            as[atoms].nucleus = c0;
            // size of component using algorithm from ibiblio.org M-set e-notes
            as[atoms].size = cabs(m_d_size(c0, as[atoms].period));
            // size of atom domain using algorithm from an earlier blog post of mine
            as[atoms].domain_size = m_d_domain_size(c0, as[atoms].period);
            // shape of component (either cardioid or disc) after Dolotin and Morozov (2008 eq. 5.8)
            as[atoms].shape = m_d_shape_discriminant(m_d_shape_estimate(c0, as[atoms].period));
            atoms++;
          }
        }
    }
This does give duplicates in the output array, but these can be removed later (I found it better to use a mask image (2D array) in which I marked circles around each label, after checking whether the location has already been marked, than to use a quadratic-time loop comparing locations with a threshold distance). Depending on the size of the circles, this also helps prevents messy label overlaps.
One problem is that the range of atom domain sizes can be huge, with domains in filaments being orders of magnitude smaller than the sizes present in embedded Julia sets. This can be fixed with some hacks:
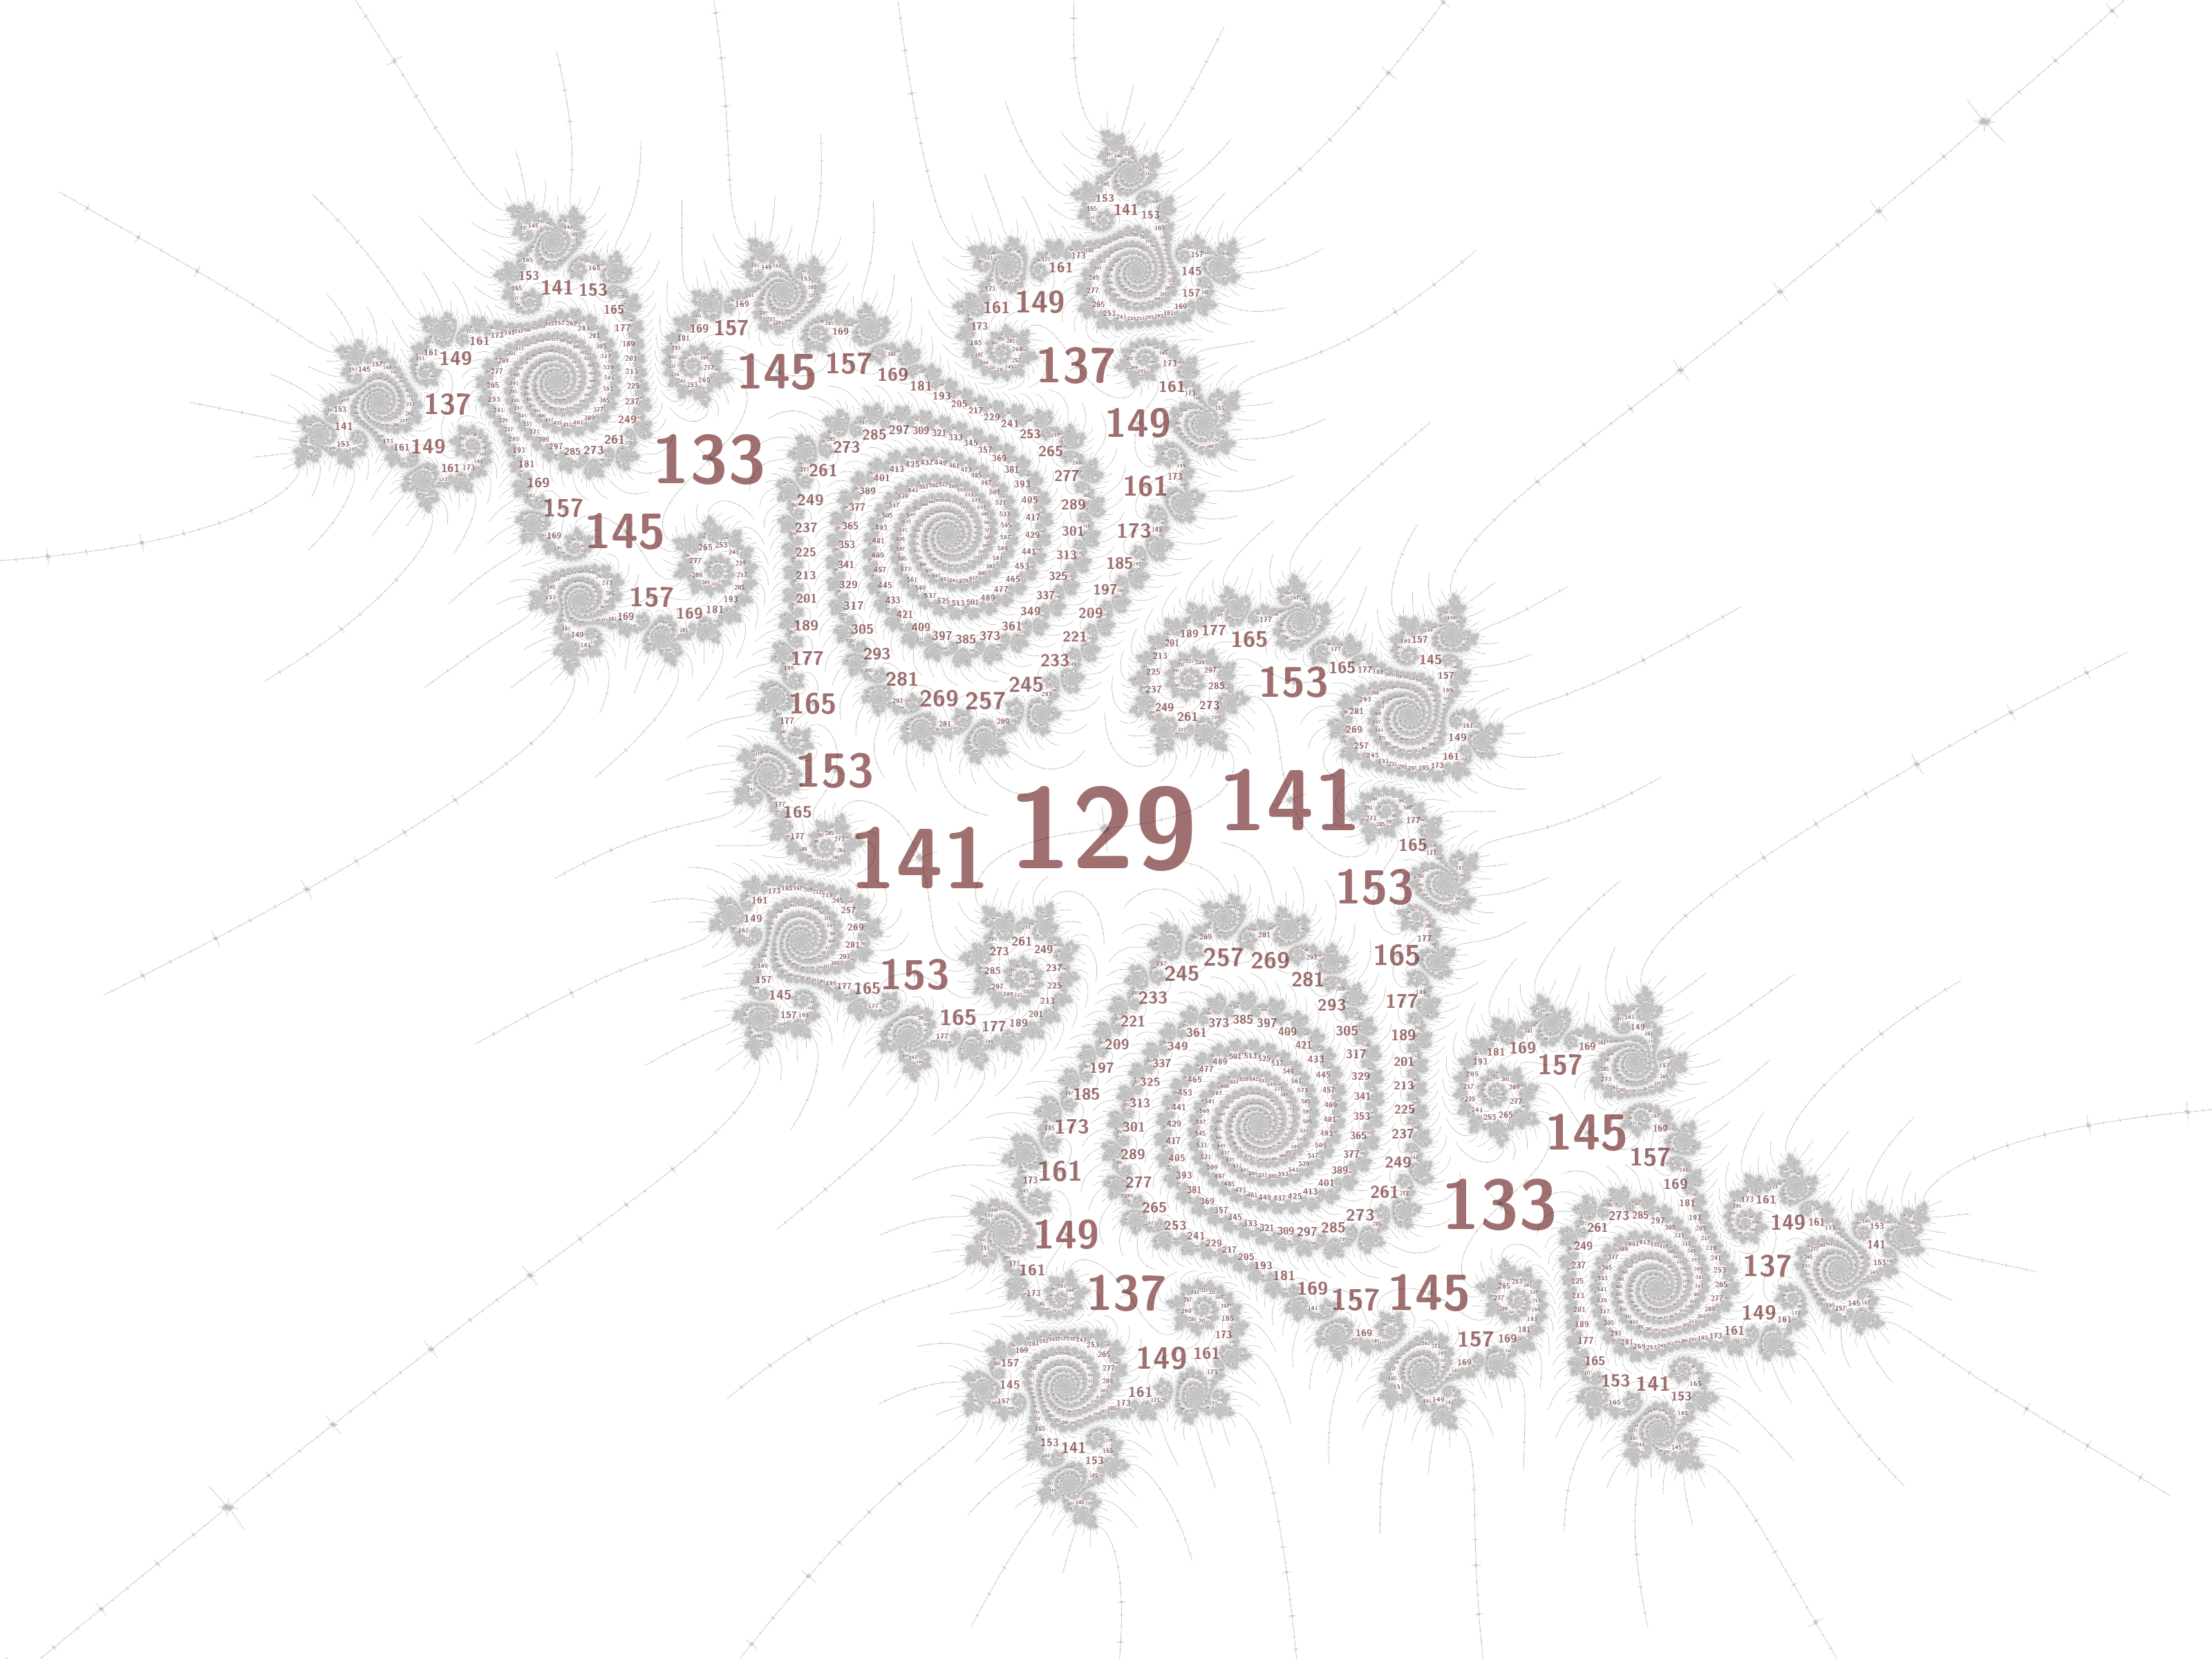
The image above calculates the font size like this:
// convert to pixel coordinates
int p = as[a].period;
double _Complex c0 = as[a].nucleus;
double _Complex dc0 = p == 1 ? 1 : as[a].domain_size; // period 1 domain is infinite
m_d_transform_reverse(transform, &c0, &dc0);
// shrink disc labels a bit to avoid overlaps
double fs = (as[a].shape == m_cardioid ? 1 : 0.5) * cabs(dc0);
// rescale filament labels using properties of periods in this particular embedded Julia set
if ((p % 4) != (129 % 4))
  fs = 8 * log2(fs) + maxfontsize;
// ensure a minimum label size
fs = fmax(fs, minfontsize);
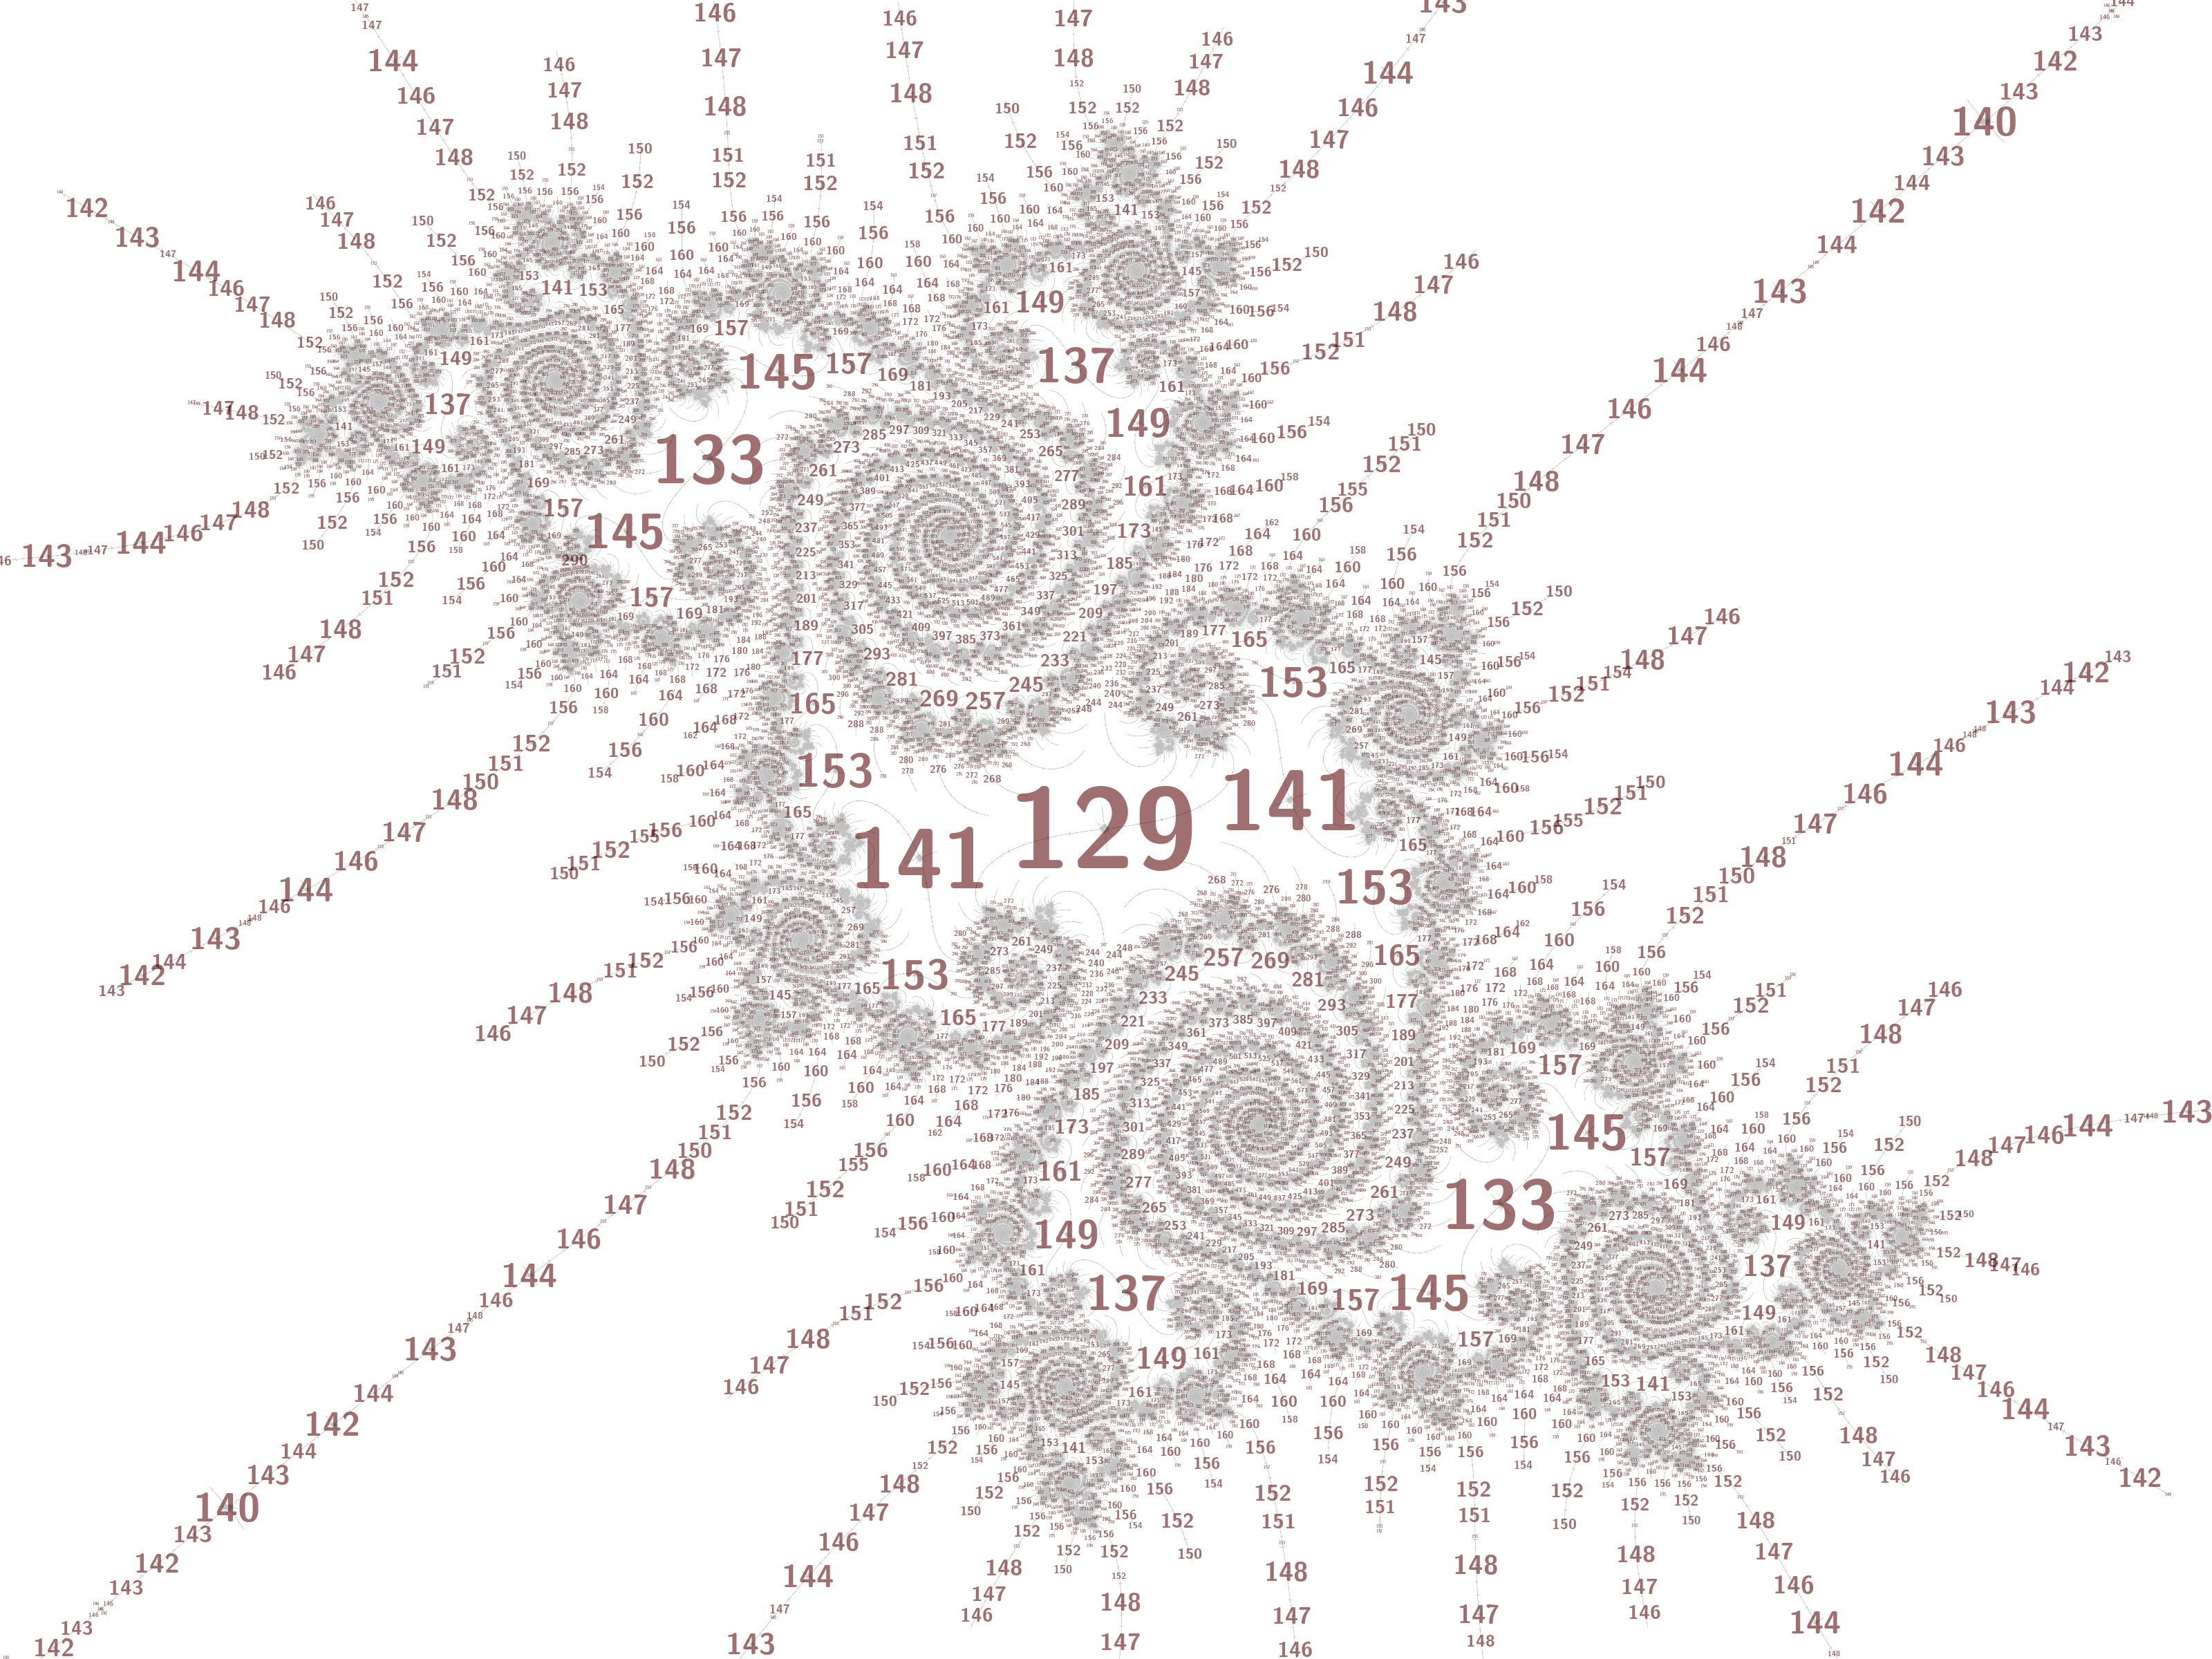
The image below replaces the specific period property
(p % 4) != (129 % 4) with (p % 4) != 0. I'll
figure out how best to generalize this and allow command-line arguments,
at the moment I've just been editing the code and recompiling to adapt
to different views, hardly ideal.
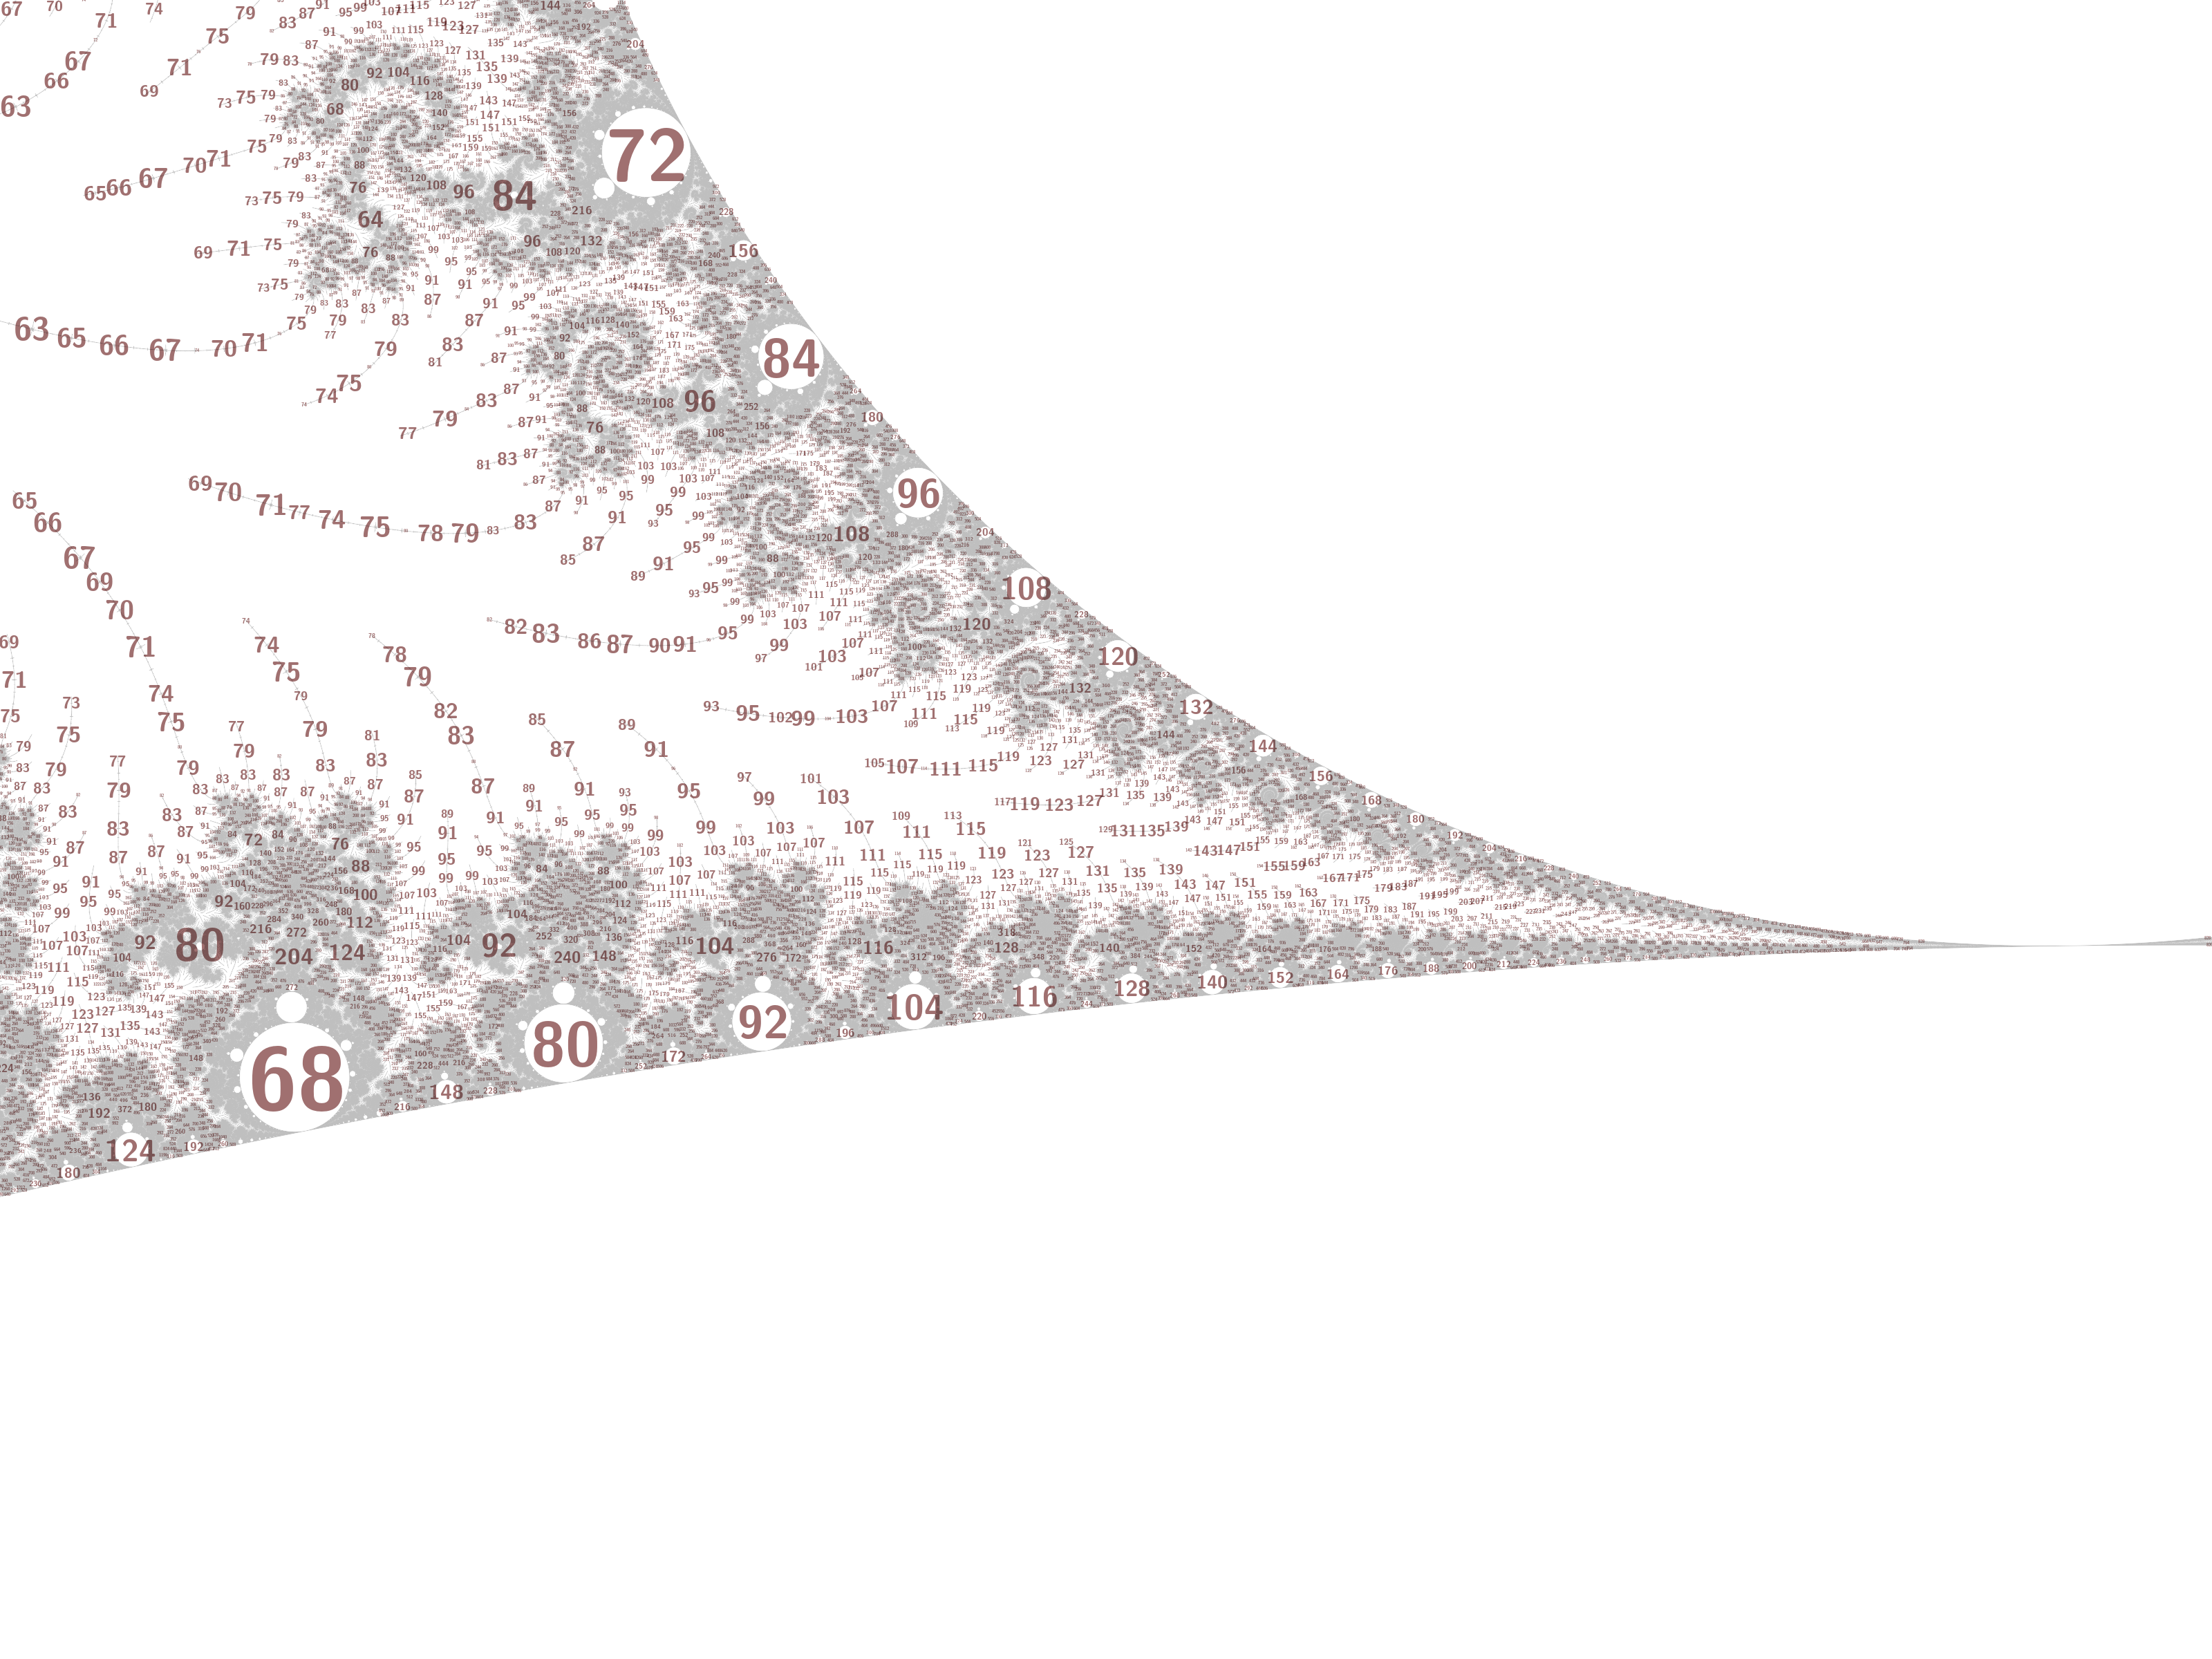
You can click the pictures for bigger versions (a few MB each). The
last 3 images are centered on
-1.9409856638151786271684397e+00 + 6.4820395780451436662598436e-04 i.
After a few more cleanups I'll push the code to my mandelbrot-graphics
git repository linked above.