Distance estimation for voting simulation visualisation
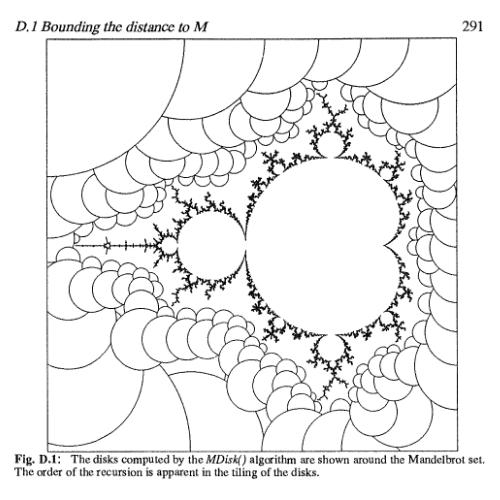
Distance estimation is commonly used in fractal rendering. In Appendix D of The Science Of Fractal Images, Yuval Fisher describes an algorithm for rendering the Mandelbrot set by drawing discs that can't possibly contain any of the boundary of the set, using the distance estimate at the centre to bound the radius of the discs. Any point inside a disc need not be considered, which speeds up rendering by reducing the number of points (and their discs) that need to be computed:
Today in the #haskell-blah IRC channel, lpsmith was wondering about how to speed up visualisation of voting simulations. The models are described here:
Each point in the image corresponds to an election with the center of opinion located at that point. For every point, we simulate an entire election by scattering 200000 voters in a normal distribution around that point and collecting ballots from all of the voters; then we colour the point to indicate the winner.
-- Ka-Ping Yee
Imagine the N "candidates" are N fixed points in the Euclidean plane. The voters also are points in that plane, but imagine they are random points sampled from a 2-dimensional Gaussian distribution with prescribed variance and prescribed centerpoint (peak location) (x,y). Imagine these voters conduct an election to choose a winner. Voters prefer candidates that are nearer to them ("utility is a decreasing function of voter-candidate distance"). We then color the pixel at (x,y) with the color of the winner (selected from a fixed N-color palette). Do this for every (x,y) and the result is a multicolored picture. You get different pictures depending on the candidate-coordinates, the voting method used, and the variance of the Gaussian.
-- Warren D Smith
The distance estimation algorithm I came up with works like this. You have a fixed number of candidates as points in a 2D space. Form the perpendicular bisectors between each pair of candidates. This divides the space into a number of regions. Pick an individual voter. Find the minimum of the distances from the voter coordinates to the perpendicular bisectors between the pairs of candidates. Then a circle centered at the voter with this distance as its radius will be inside one of the regions in space. The candidate that the voter votes for will be the same everywhere in that circle.
But an electorate is a large number of voters. Do the above process for all the voters in the electorate, tallying up the votes cast for each voter, and forming a collection of all the voter radii. Once all the votes are cast, you have the totals for each candidate, so you know which candidate won, how many votes they received, and how many votes the second-place candidate got. The result of the election to change requires a number of voters at least half the difference between the winner's votes and the runner up's votes to change their mind - call this number the swing.
Now sort the collection of voter radii in ascending order, and pick the swing'th radius in the sorted collection. Now, if all the voters in the electorate shifted their opinion by that radius, only the swing voters could possibly have changed the candidate they voted for. So if the electorate shifted by less than that radius, the outcome of the election must remain the same. This allows us to fill a circle in the space of electorates (which we are aiming to visualize) with the election result, so we don't need to simulate elections for any of the other points that are inside it.
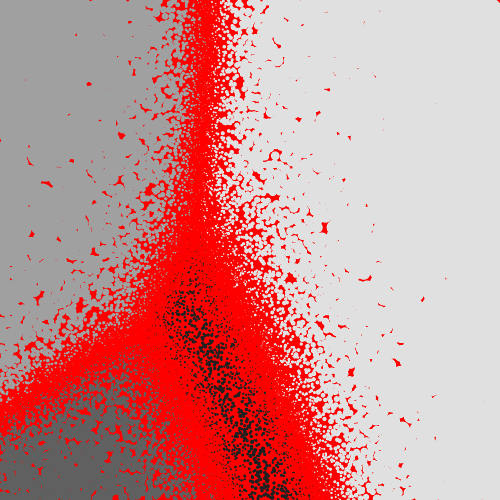
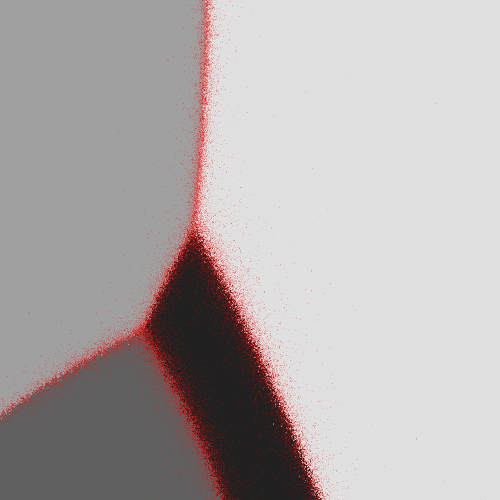
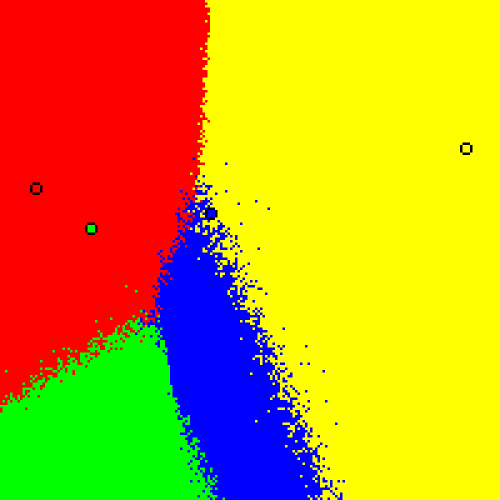
Here are some results of a 2000x2000 pixel image, first with 8k electorate samples taking around 1min and then with 80k electorate samples taking around 10min (consider that rendering each pixel individually would need 4M samples, estimated time to compute around 8 hours). Third is the reference image taken from Warren D Smith's website. All the images represent (0,0)-(200,200) with candidate coordinates (84, 114), (36, 108), (14, 124), and (186, 140), with σ=100, using Plurality voting method.
Source code in C99 using Cairo for graphics: votesim.c