Graphing heap profiles
EDIT (2010-07-29): this post is somewhat misleading regarding #2 below. See GHC ticket #4225 for some additional clarification.
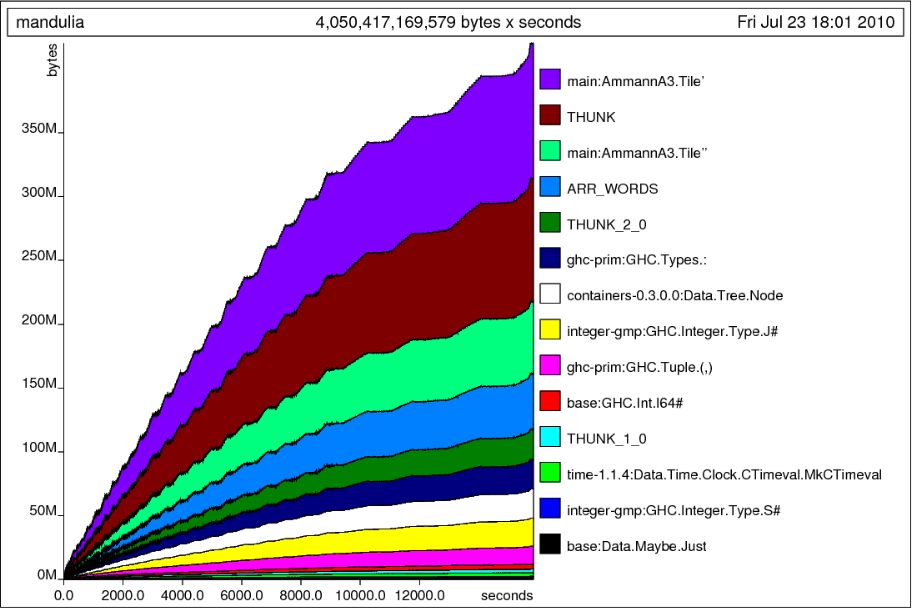
hp2ps is a tool for generating graphs (in the PostScript file format) from heap profile logs dumped by the GHC RTS for Haskell programs. These graphs are invaluable for debugging errant programs and reducing memory consumption, but there are some problems:
- hp2ps is written in C that no one seems willing to maintain
- heap profile logs have time stamps that include the overhead of profiling
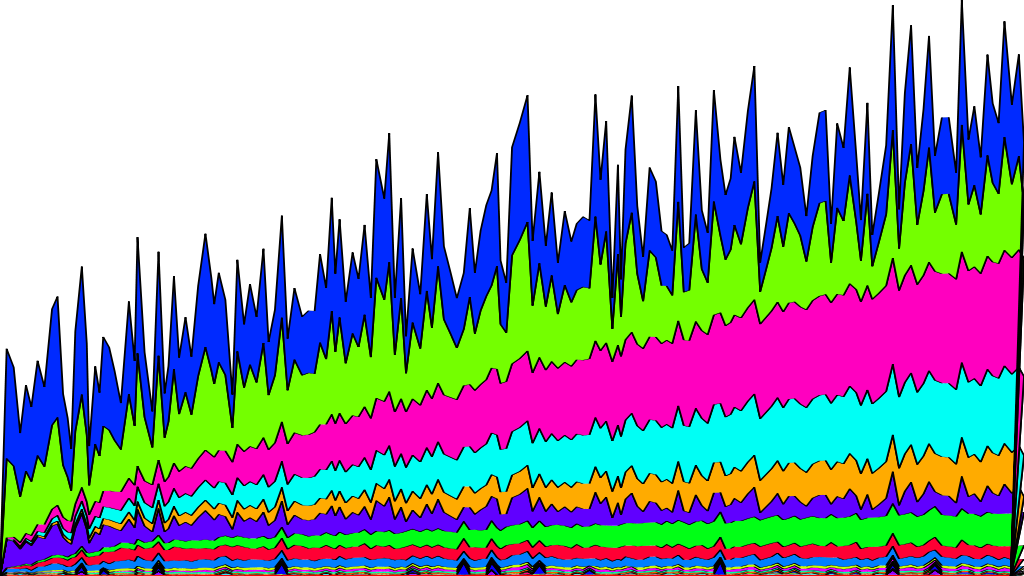
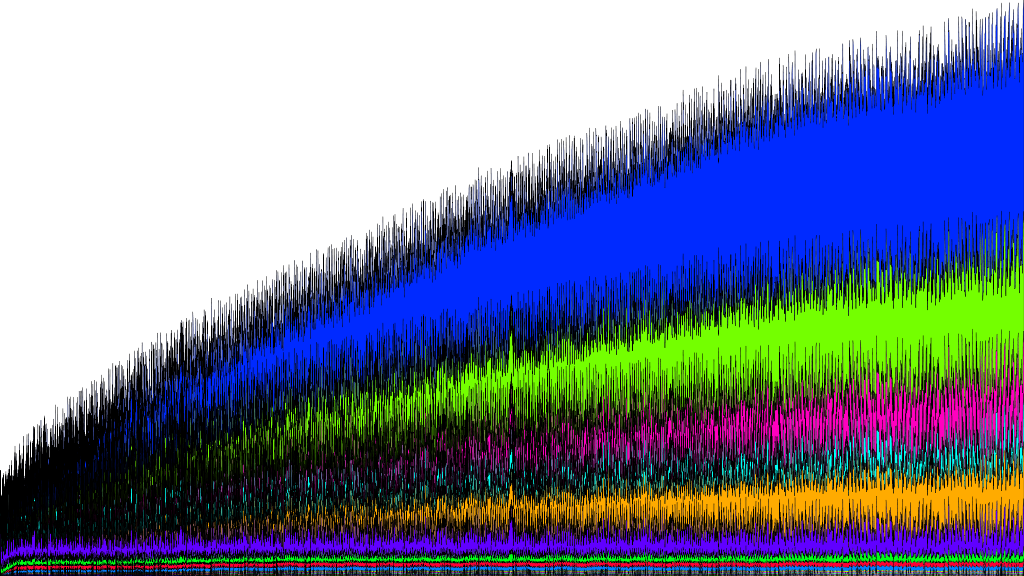
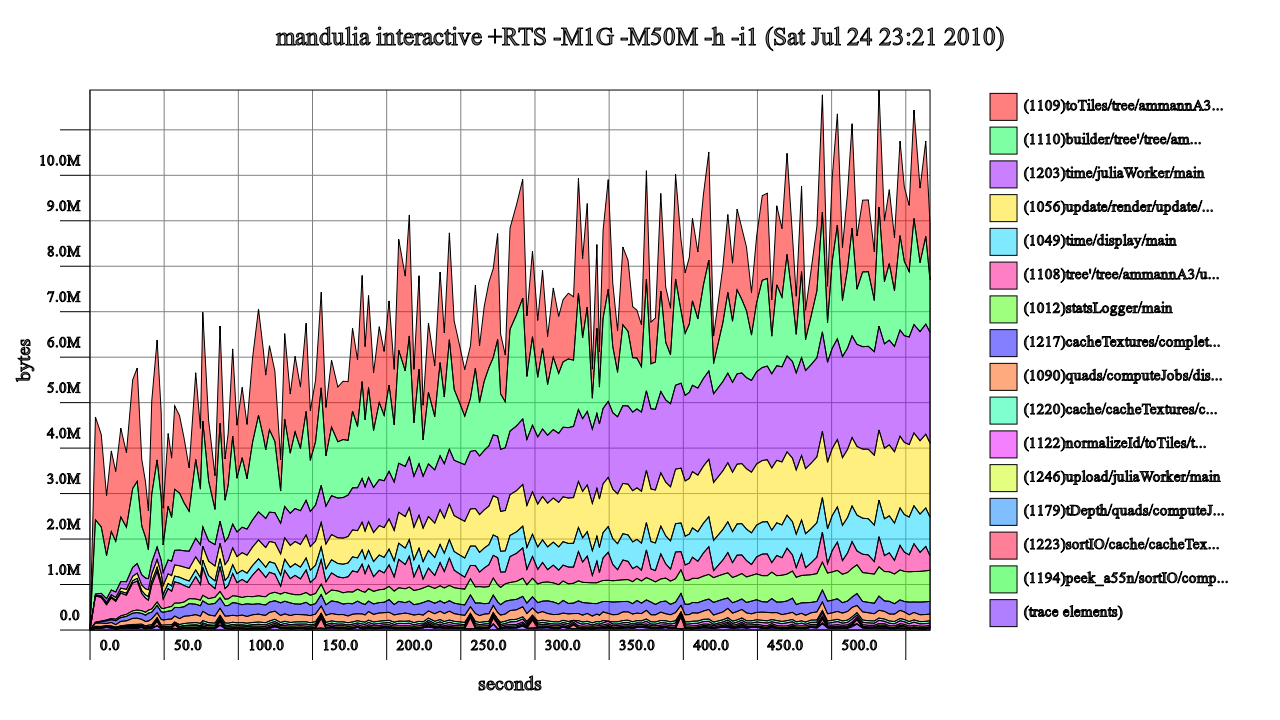
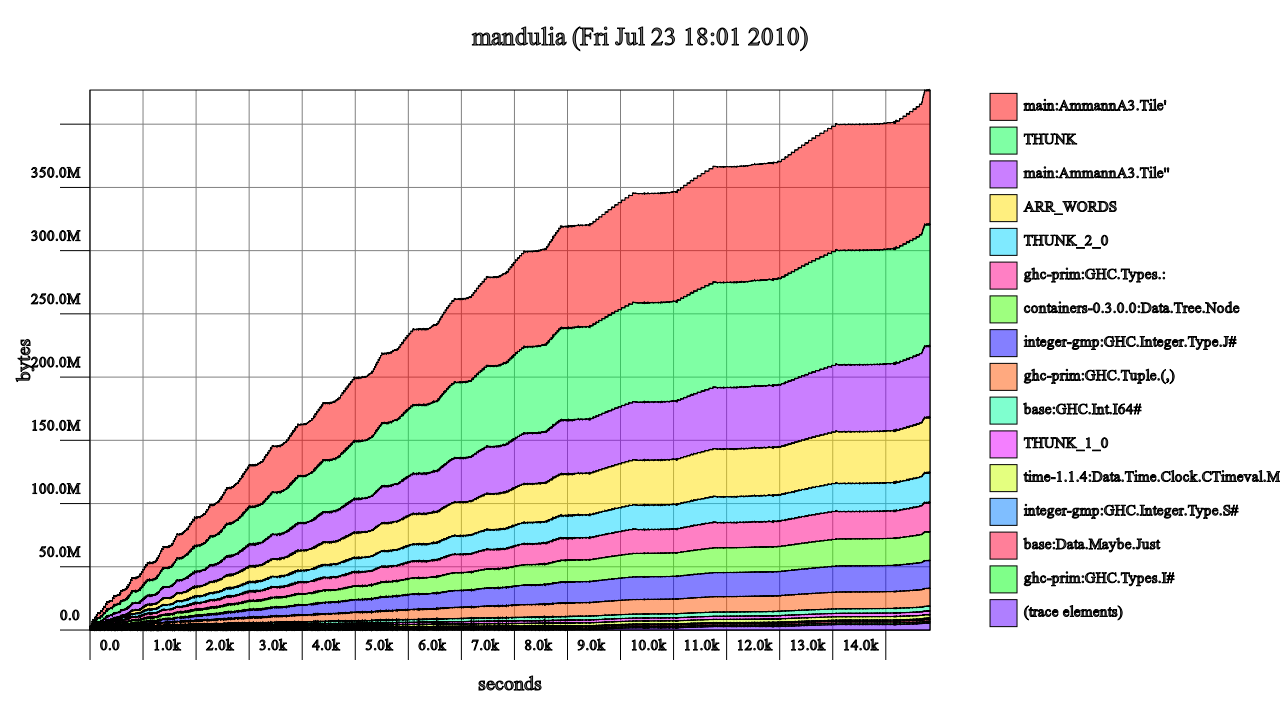
- the output graphs aren't as beautiful as they could be
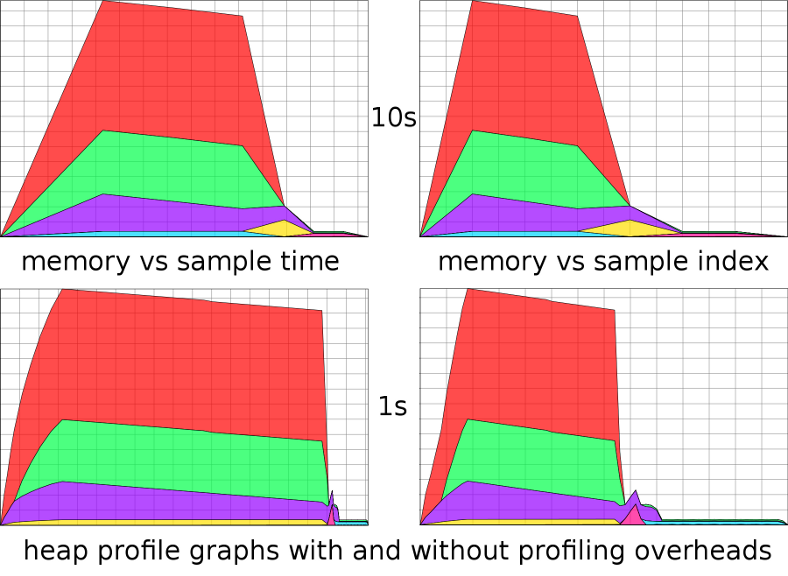
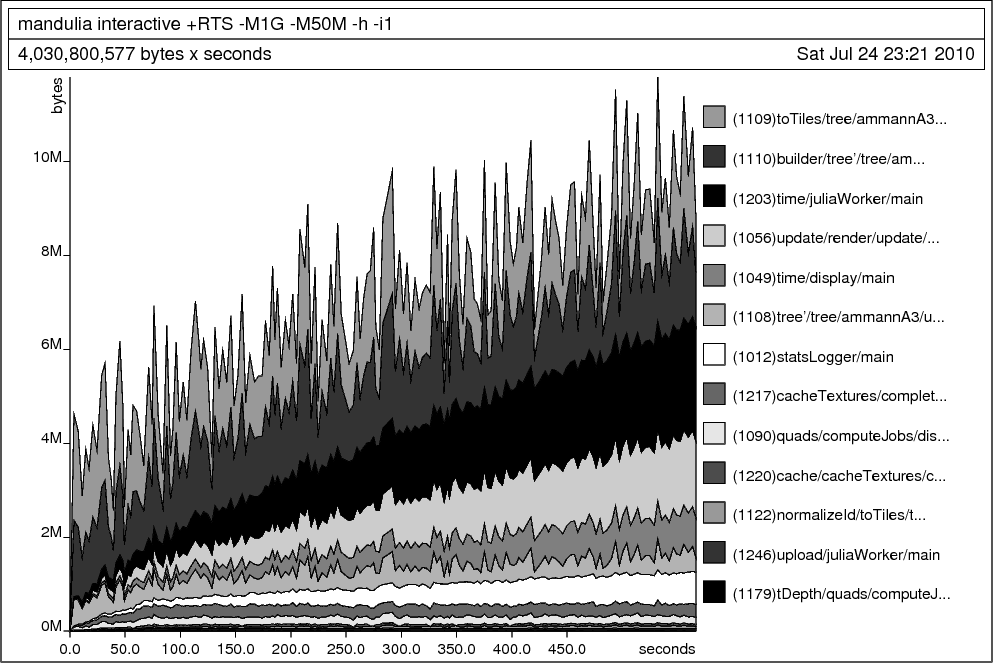
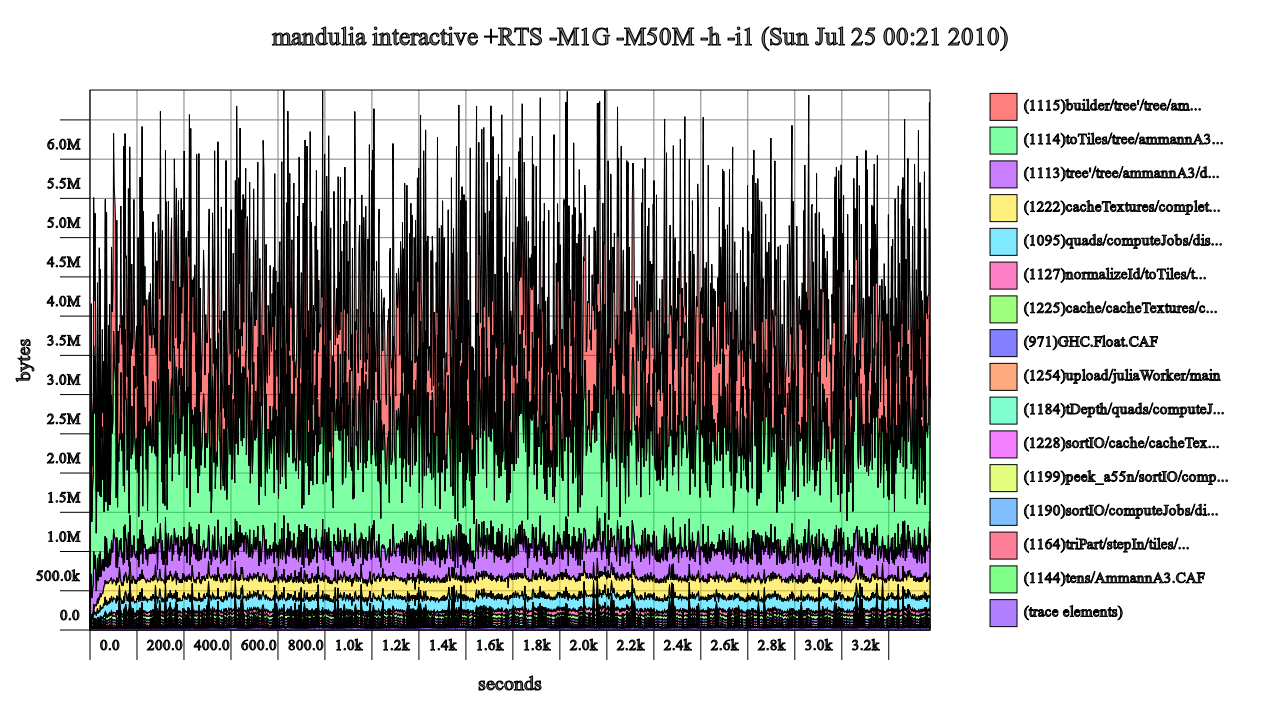
In particular, #2 can give very misleading graphs, where periods of high heap usage appear to dominate the running time. This warping is because (fairly obviously) it takes longer to generate a heap profile sample when the heap is larger. With the profiling overheads taken out, you can compare graphs with different heap sample intervals more easily, because the shape will be the same (only with more or less detail).
I've been working on a replacement for hp2ps, written in Haskell (which solves #1). I added an option to graph against sample index instead of sample time (which solves #2, provided that the heap sample interval is constant, which is currently the case). And hopefully the pictures show that I'm making progress on #3:

Currently I'm just building up SVG strings, but I should switch to using a library such as wumpus-core to get both PostScript and SVG output (the other alternatives for vector graphics output available on Hackage seem to have heavy external library dependencies such as Cairo or OpenGL).
The code is available at hp2pretty/hp2pretty on Gitorious hp2pretty on code.mathr.co.uk.