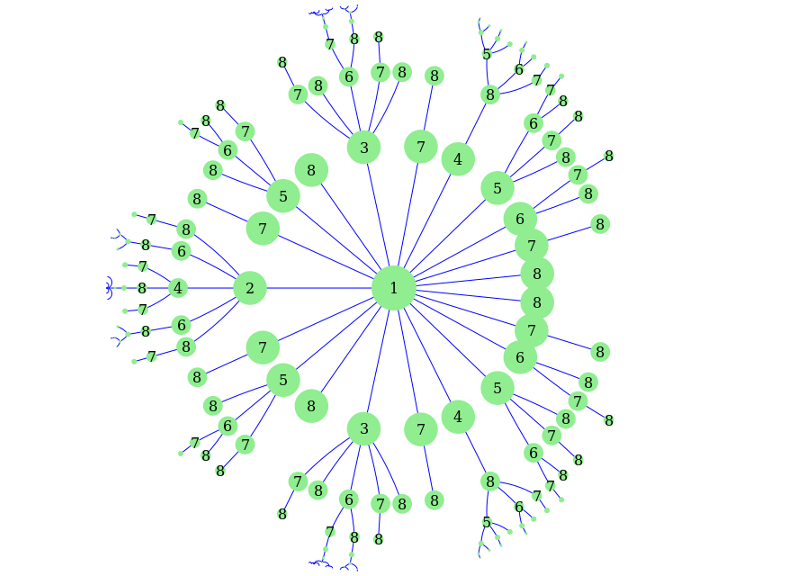
Abstract Mandelbrot tree
While Lavaurs' algorithm is nice for getting at the structure of the Mandelbrot set, the standard visualisation of a circle with arcs makes it rather hard to see what's going on. While reading Internal addresses in the Mandelbrot set and irreducibility of polynomials I saw some nice diagrams of trees of Mandelbrot sets. I set about visualizing my Haskell implementation of Lavaurs' algorithm in a similar way.
I had already modified my previous lavaurs.hs source code to use an intermediate tree structure for optimization purposes, so now it was quite simple to output JSON formatted data and some boilerplate HTML and Javascript that uses the Javascript InfoVis Toolkit to generate an interactive hypertree visualisation. To move around, click on the text that labels nodes with their periods. If nothing displays, check your browser error console - it seems my Firefox goes up to 11 but beyond that it spits "too much recursion" and gives up.
Lots of features to add - including colouring nodes / edges according to tangency or islandhood, and some way of showing the angled internal addresses (I'll write about computing those at a later date). The Lavaurs' to JSON conversion code (via dirty string concatenation, again...) is quite simple:
> data Arc = Arc{ left :: !Q, right :: !Q, children :: [Arc], island :: !Bool }

> toJSON k Arc{ left = p, right = q, children = cs, island = i }
>   = (k', "{ id: \"" ++ show k ++ "\", name: \"" ++ show (period p) ++
>          "\", children: [" ++ intercalate "," js ++ "]}")
>   where
>     (k', js) = toJSONs (k + 1) cs

> toJSONs k [] = (k, [])
> toJSONs k (c:cs) = (k'', j:js)
>   where
>    (k', j) = toJSON k c
>    (k'', js) = toJSONs k' cs