Deep zoom rendering cost
I benchmarked some Mandelbrot set renderers. Click pictures for bigger versions. The corresponding deep zoom images are these:
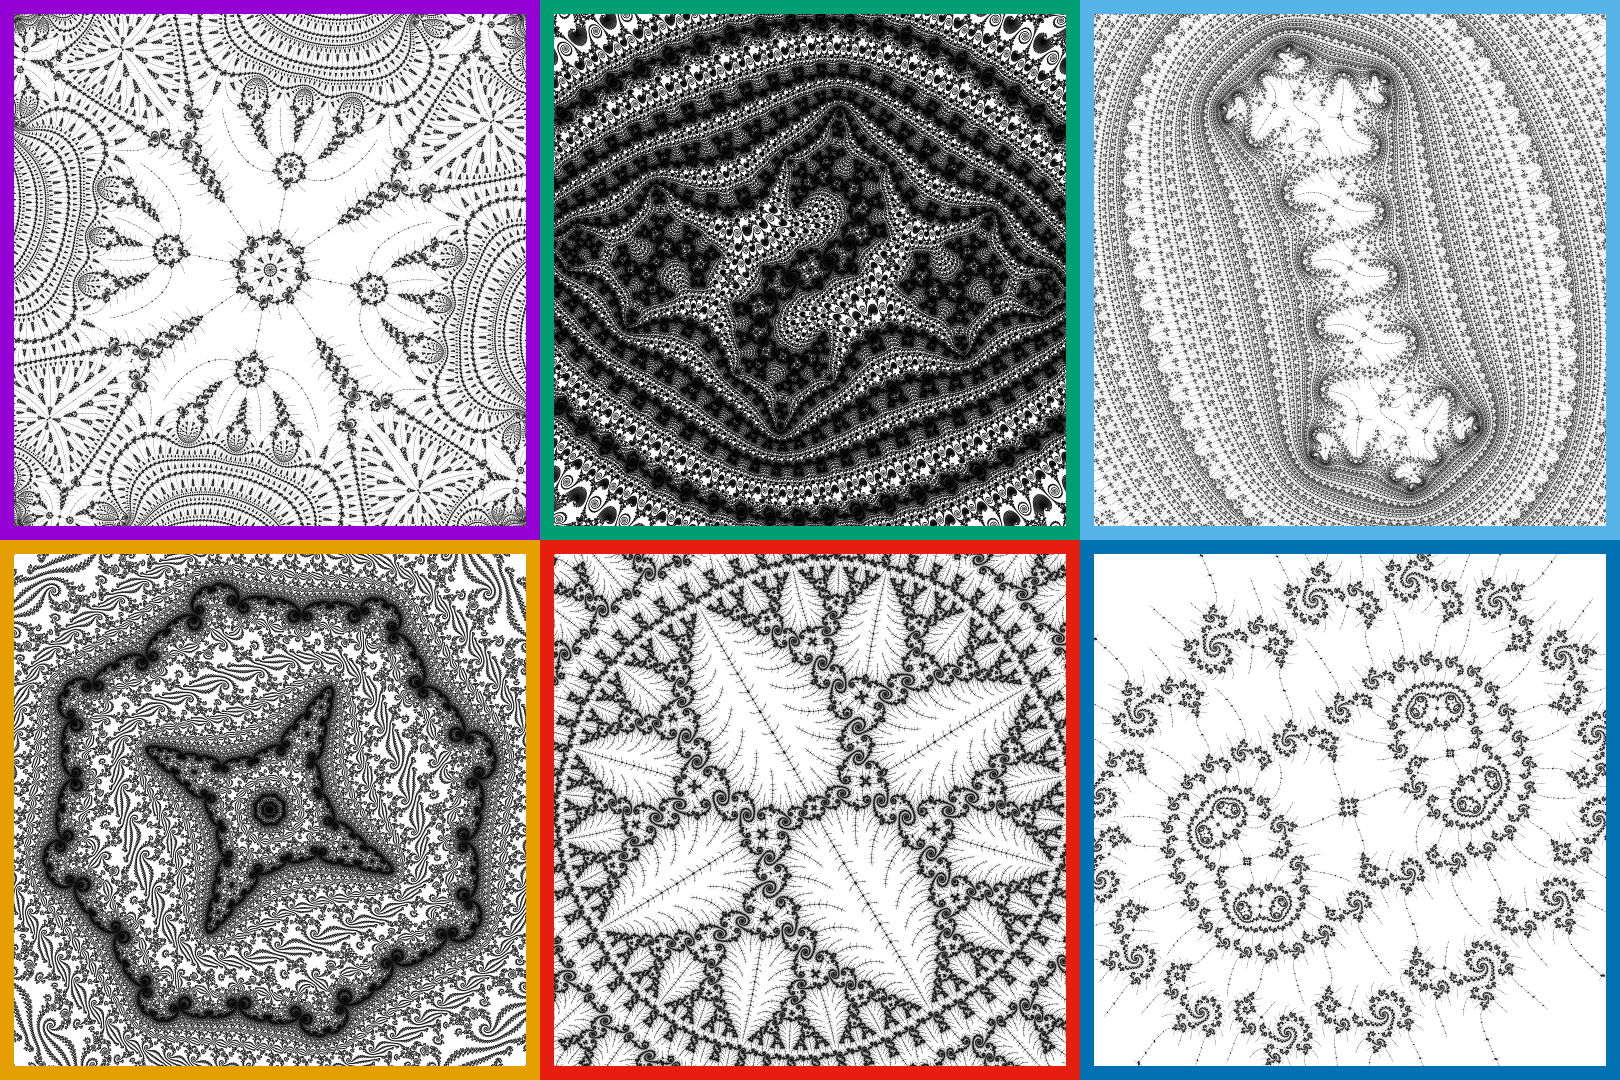
Location credits:
| Olbaid-ST Deep Mandelbrot Zoom 023 |
Dinkydau Evolution Of Trees |
Dinkydau Ssssssssss |
| (self-made) | (self-made) | (self-made) |
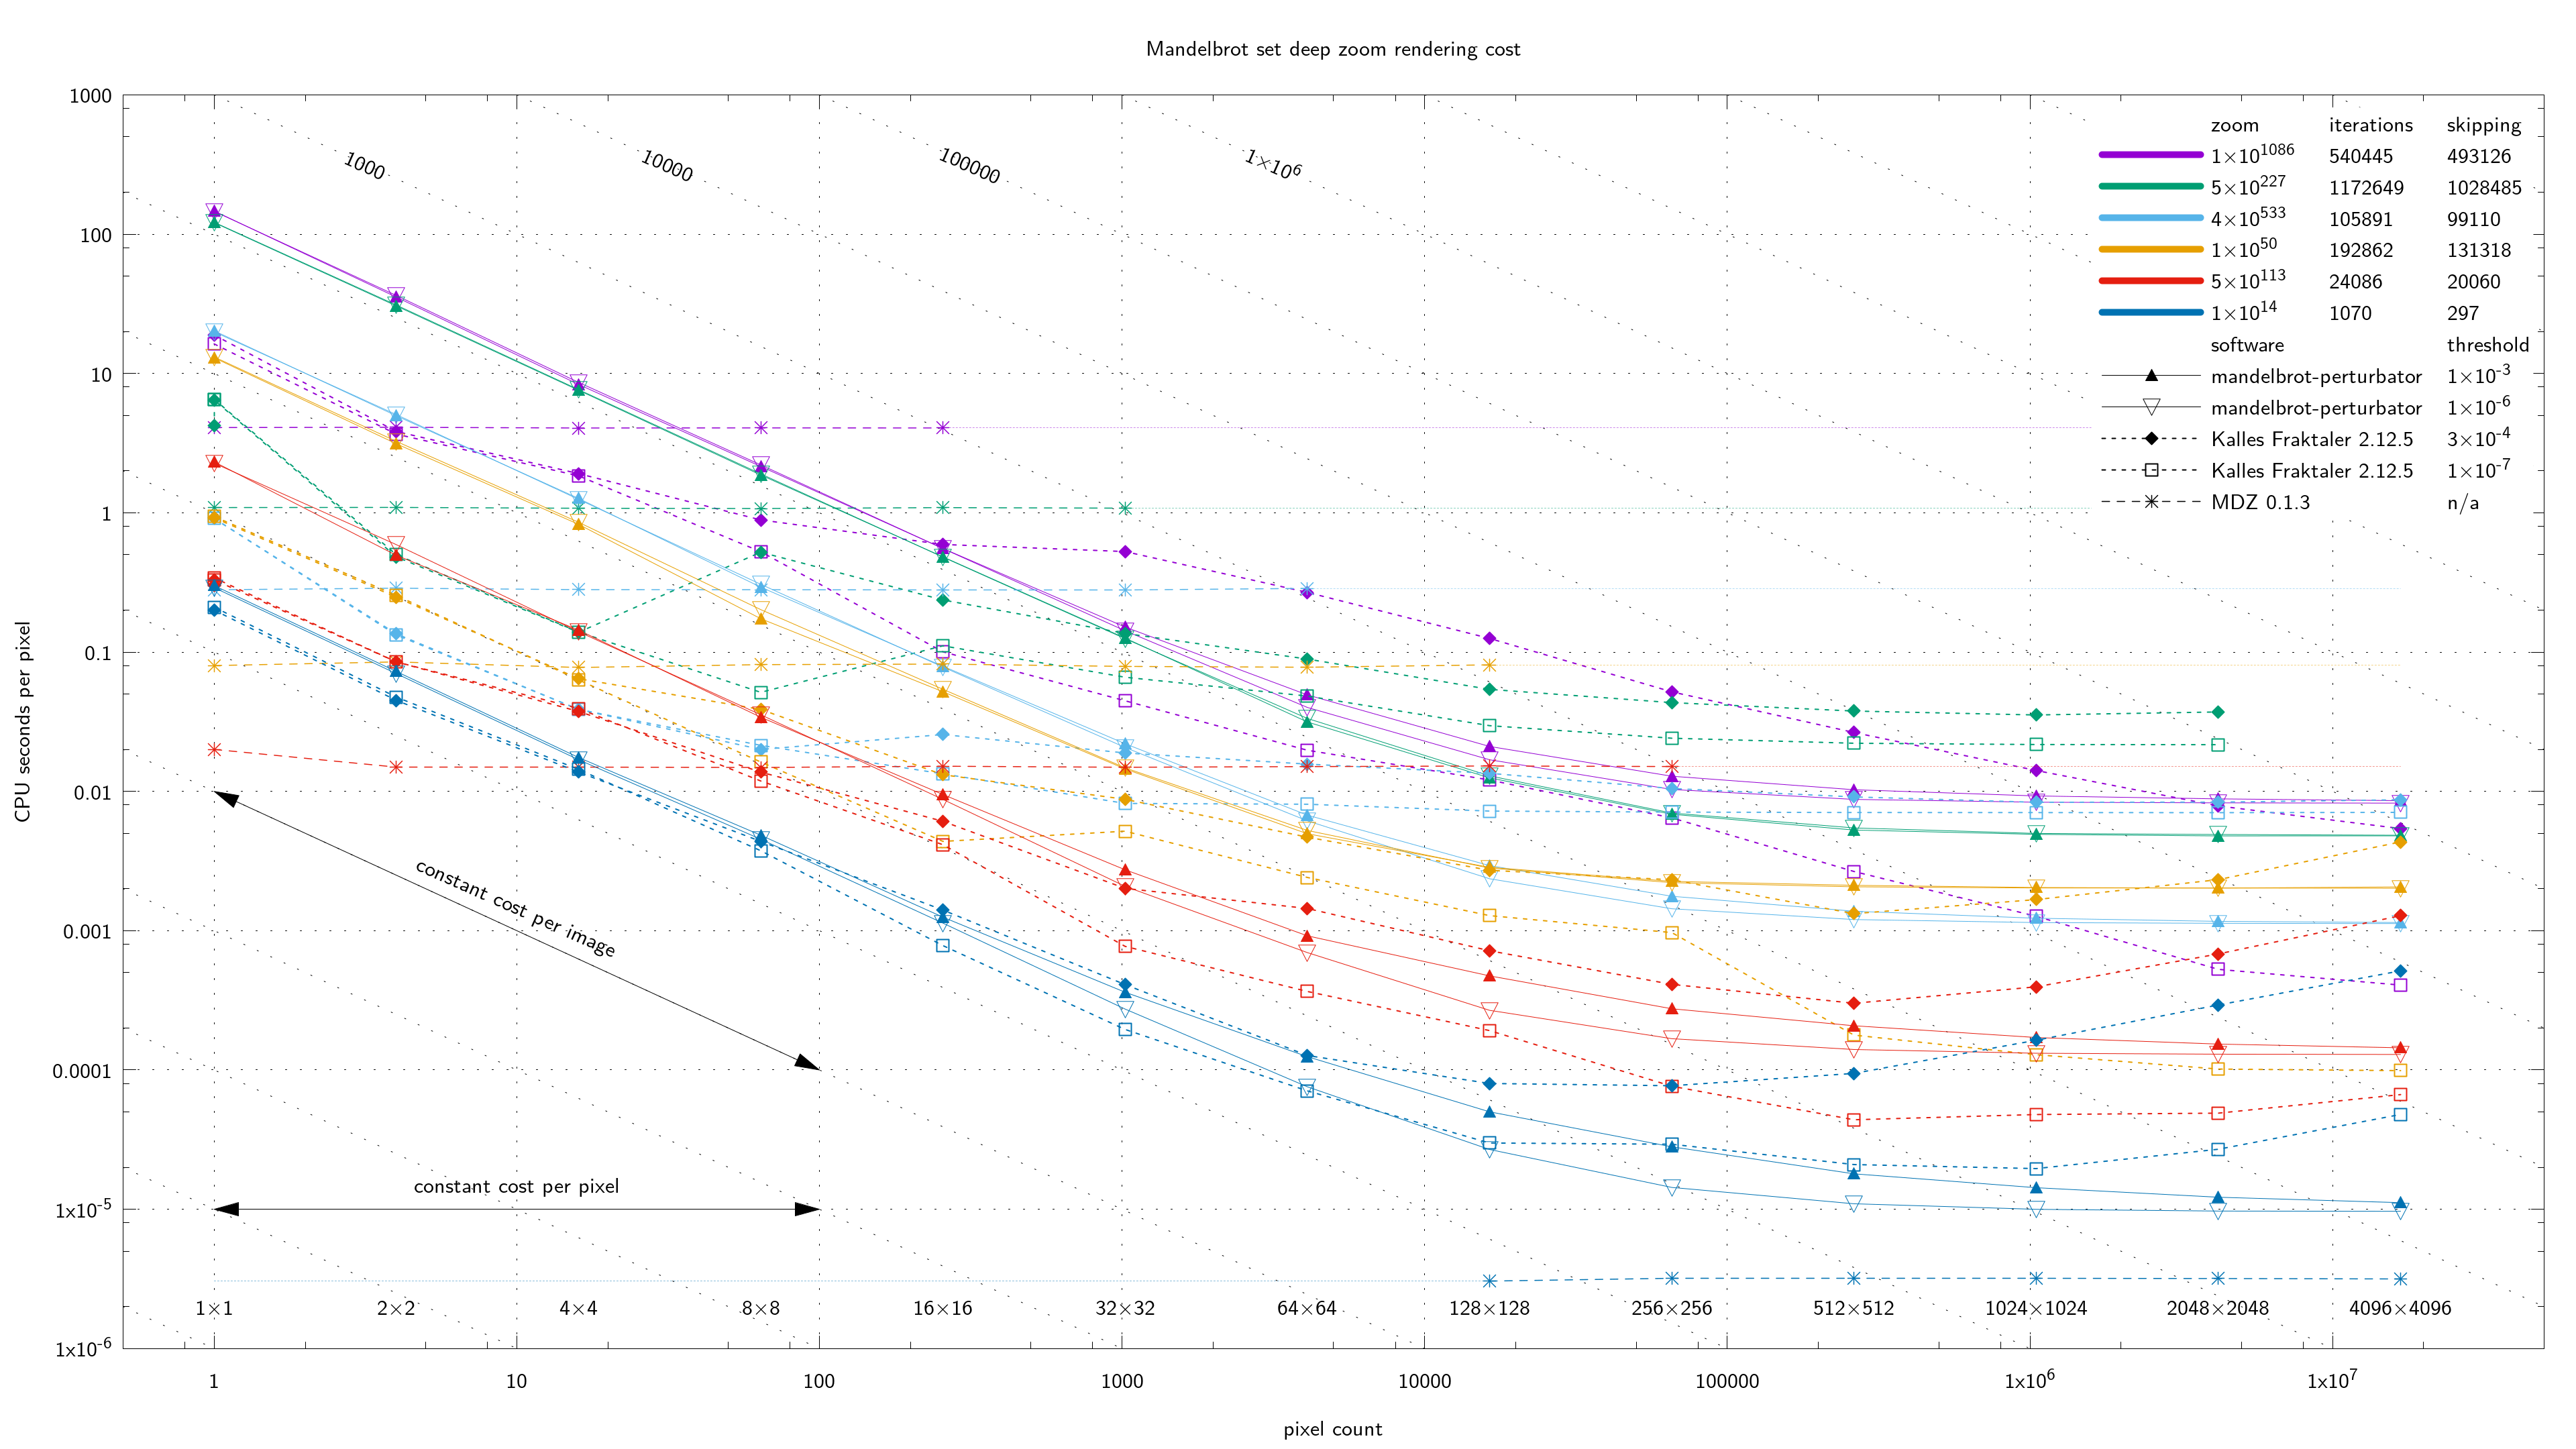
Traditional deep zoom rendering with arbitrary precision calculations has a constant cost per pixel. This is visiable on the graph as horizontal lines for the renderer MDZ (Mandelbrot Deep Zoom), version 0.1.3 is an unreleased version with some small changes I made to allow the benchmarks to be run from a shell script. On the graph bottom right you can see native machine precision in MDZ is much faster than any perturbation renderer.
Perturbation techniques allow native precision to be used for the bulk of the calculations, as deltas from an arbitrary precision reference. Series approximation techniques allow many per-pixel iterations to be skipped entirely. There is some per-image overhead, but the eventual per-pixel cost is lower when the image size increases. This is visible on the graph as downward sloping lines for the renderer Kalles Fraktaler, version 2.12.5 will be released next month with some bug fixes and command line rendering support, and the renderer mandelbrot-perturbator, which is still highly experimental.
Each of these renderers has two lines, with different thresholds for Pauldelbrot's glitch detection heuristic. One conclusion to be drawn is that the threshold has minimal impact on mandelbrot-perturbator render times, while the higher threshold (necessary for correctness with some locations) can slow Kalles Fraktaler down by a significant amount. Kalles Fraktaler is typically slower than mandelbrot-perturbator with this more accurate mode.
A final conclusion is that while mandelbrot-perturbator flattens out to a constant low cost per pixel as the image size increases, at some locations Kalles Fraktaler starts to slow down further (the lines slope upwards). This indicates some performance bug that I hope to investigate at some point next month. In the mean time tiled rendering might be cheaper.
These benchmarks represent 20 days of (single core) CPU time on a quad core AMD Athlon II X4 640 Processor underclocked to 2.3GHz due to thermal issues. The benchmark data is in the Kalles Fraktaler 2 source code repository.