Lozenge
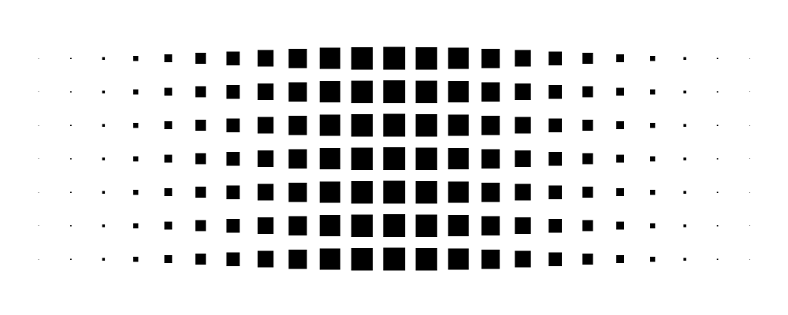
Based on a drawing from a year an a half ago:
I showed it to Brent Yorgey in the #diagrams IRC channel and he made this:
strip :: (Double -> Double) -> Double -> Double -> Int -> Double -> Diagram SVG R2
strip f lo hi n offset
  = [lo, lo + (hi - lo) / (fromIntegral n - 1) .. hi]
  # map (square . f)
  # hcat' with {sep = offset, catMethod = Distrib}
  # fc black

example = vcat' with { sep = 3, catMethod = Distrib } (replicate 7 str)
        # centerXY # pad 1.5
  where str = strip (\x -> cos x + 1) (-pi) pi 23 3
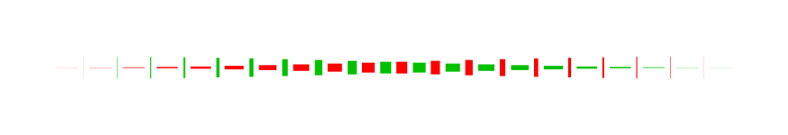
--Lozenge (Brent Yorgey)Then I showed him how they interleave and he made this:
strip :: (Double -> Double) -> Double -> Double -> Int -> Double -> Diagram SVG R2
strip f lo hi n offset
  = [lo, lo + (hi - lo) / (fromIntegral n - 1) .. hi]
  # map (square . f)
  # hcat' with {sep = offset, catMethod = Distrib}

lozenge = vcat' with { sep = 3, catMethod = Distrib } (replicate 7 str)
        # centerXY
  where str = strip (\x -> cos x + 1) (-pi) pi 23 3

example = mconcat
  [ lozenge # fc black
  , lozenge # fc red
    # translateY (-1.5)
    # translateX (width lozenge / 2 - 4.5)
  ]
--Lozenges (Brent Yorgey)These are so much simpler than my original code which was horrible C numerical stuff to converge a waveform to the right shape, printing numbers which I fed into GNUplot and then editing the image with GIMP to correct the aspect ratio. I don't have that original code any more, but here's a similar version:
#include <math.h>
#include <stdio.h>
#include <stdlib.h>

const double pi = 3.141592653589793;

int cmp(const void *x, const void *y) {
  const double *a = x;
  const double *b = y;
  if (*a < *b) return -1;
  if (*a > *b) return 1;
  return 0;
}

double y(double x) {
  return (cos(pi * x) + 1) / 2;
}

int main(int argc, char **argv) {
  if (argc < 2) {
    return 1;
  }
  int n = atoi(argv[1]);
  double a[2];
  double x[2][n+1];
  int w = 0;
  a[0] = 0.001;
  for (int i = 0; i <= n; ++i) {
    x[0][i] = (2.0 * i) / (2.0 * n + 1.0);
  }
  x[1][0] = 0;
  while (1) {
    printf("a\t= %g\n", a[w]);
    for (int i = 0; i <= n; ++i) {
      printf("x[%d]\t= %g\t%g\n", i, x[w][i], y(x[w][i]));
    }
    double s = y(x[w][0]);
    for (int i = 1; i <= n; ++i) {
      s += 2 * y(x[w][i]);
    }
    a[1 - w] = 1 / s;
    for (int i = 1; i <= n; ++i) {
      x[1 - w][i] = x[w][i-1] + a[w] *
        ((y(x[w][i-1]) + y(x[w][i]))/2 + y(x[w][n+1-i]));
    }
    w = 1 - w;
    qsort(&x[w][0], n+1, sizeof(x[w][0]), cmp);
  }
  return 0;
}
gcc -std=c99 -lm lozenge.c ./a.out 19 | head -n 2100 | tail -n 20 > lozenge.dat ; gnuplotunset key unset xtics unset ytics unset border set style fill solid set terminal png size 8192,8192 set output "lozenge-raw.png" plot [-0.2:1.2] [-0.7:0.7] "lozenge.dat" using 3:(0):\ ($3 - $4 * 0.0512405/3):($3 + $4 * 0.0512405/3):\ ((-1+$4) * 0.0512405/3):((1-$4) * 0.0512405/3) with boxxyerrorbars,\ "lozenge.dat" using (1-$3):(0):\ (1-$3 - $4 * 0.0512405/3):(1-$3 + $4 * 0.0512405/3):\ ((-1+$4) * 0.0512405/3):((1-$4) * 0.0512405/3) with boxxyerrorbarsgimp (crop image)
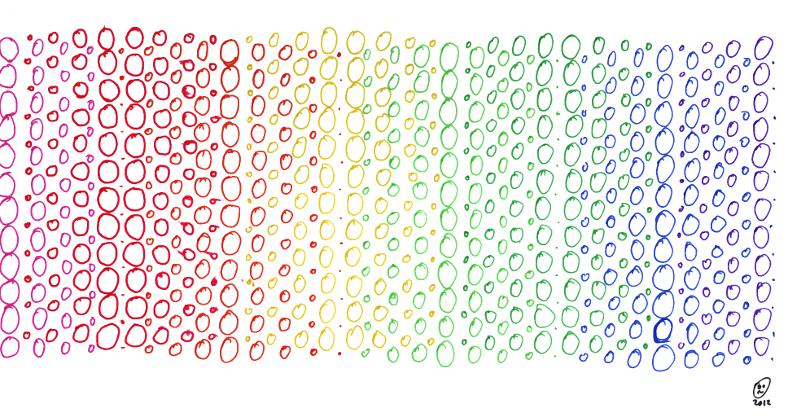
A further experiment led to this gradient with 5 colours out of phase:
Do check out the links above to the Haskell diagrams pastebin, it's quite awesome.